Introduction
The Problem: Finding Your Arc Data
When you deploy Azure Arc for Servers, you expect all your data to be in one place. But Azure distributes Arc server information across three specialized data sources: Resource Graph for inventory, Log Analytics for operations, and Defender XDR for security context. This isn't poor design - it's intentional, giving you specialized tools for different management aspects.
The challenge? Most people assume everything is centralized. They enable Defender for Servers P1 or P2, expecting all data to appear in the Defender for Cloud portal, only to discover their actual server data lives elsewhere entirely. If you're new to Azure, this can derail your daily work quickly.
Nothing in Azure happens automatically. Successful Arc implementations require Azure policies to drive actions and automation for daily tasks like onboarding, offboarding, and health monitoring. Without proper automation and policies, you might wonder why your Arc servers don't appear in Defender XDR - it's because service connections require intentional configuration.
For comprehensive deployment strategies and enterprise architecture planning, see our Azure Arc setup guide covering end-to-end Arc adoption with automation best practices.
What This Guide Delivers
This guide maps exactly where your Azure Arc server data lives and how to access it programmatically. We cover the three primary data sources with practical PowerShell examples and authentication approaches - no corporate compliance theory or ROI calculations.
The Three Places Your Arc Data Lives
Azure Resource Graph: Inventory and configuration data - machines, extensions, maintenance configurations, patch results, and Defender for Cloud security assessments.
Log Analytics Workspaces: Operational telemetry - heartbeats, performance counters, activity logs, and security events. Includes ARG connector for cross-service queries.
Defender XDR APIs: Security context - device information, vulnerability assessments, exposure management, and risk scoring.
On-Premises/Multi-Cloud] subgraph "Azure Resource Graph" ARG_Resources[resources table
Machine inventory, status] ARG_Security[securityresources table
Defender assessments] ARG_Policy[policyresources table
Compliance status] ARG_Maintenance[maintenanceresources table
Patch data] end subgraph "Log Analytics Workspace" LAW_Heartbeat[Heartbeat table
Agent health] LAW_Activity[AzureActivity table
Management operations] LAW_Perf[Perf table
Performance counters] LAW_Custom[Custom tables
Security events, logs] end subgraph "Defender XDR APIs" XDR_Devices[DeviceInfo table
Device inventory] XDR_Exposure[ExposureGraphNodes
Security context] XDR_Hunting[Advanced Hunting
Security events] end ArcServer --> ARG_Resources ArcServer --> LAW_Heartbeat ArcServer --> XDR_Devices ARG_Resources -.-> ARG_Security ARG_Resources -.-> ARG_Policy ARG_Resources -.-> ARG_Maintenance LAW_Heartbeat -.-> LAW_Activity LAW_Heartbeat -.-> LAW_Perf LAW_Heartbeat -.-> LAW_Custom XDR_Devices -.-> XDR_Exposure XDR_Devices -.-> XDR_Hunting style ArcServer fill:#e1f5fe style ARG_Resources fill:#fff3e0 style LAW_Heartbeat fill:#e8f5e8 style XDR_Devices fill:#fce4ec
Azure Resource Graph: Your Arc Inventory Source
Azure Resource Graph serves as your digital library for ALL Azure resources. For Arc servers, it contains inventory, configuration, and security assessment data across multiple tables:
| Table Name | Contains | Use Cases |
|---|---|---|
| resources | Arc machines, extensions, basic properties | Inventory, connection status, agent versions |
| policyresources | Compliance and policy evaluation results | Policy compliance, governance reporting |
| securityresources | Defender for Cloud security assessments | Security recommendations, vulnerability data |
| maintenanceresources | Maintenance configurations and scheduling | Patch management, maintenance windows |
| patchinstallationresources | Azure Update Manager job results and status | Patch installation history, success/failure tracking |
| patchassessmentresources | Missing updates and patch assessment results | Available updates, security patches, compliance gaps |
| insightsresources | Data collection rules, endpoints, and associations | Monitoring configuration, data routing, agent setup |
| advisorresources | Azure Advisor recommendations including Arc agent updates | Agent update notifications, performance recommendations, security advisories |
The Arc Resources You'll Actually Query
Connected and Disconnected Machines
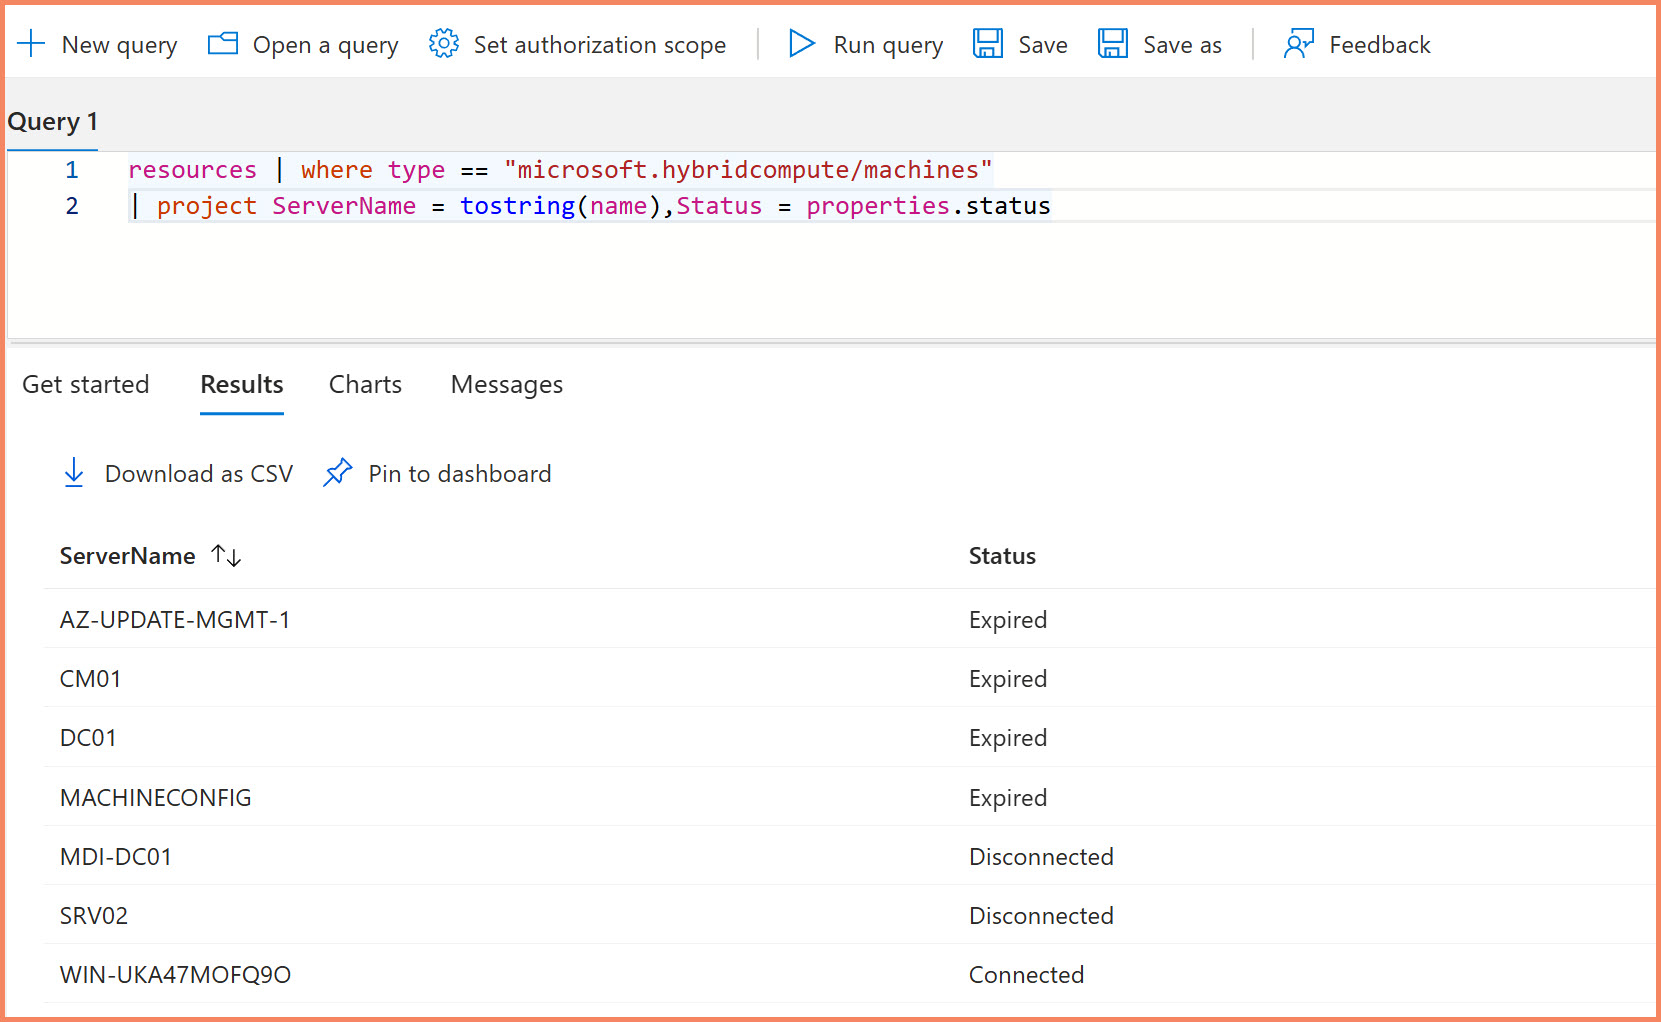
The microsoft.hybridcompute/machines resource type shows you all Arc servers, their connection status, agent versions, and basic properties. All Arc resources use the hybridcompute namespace in Resource Graph. This is your starting point for any Arc inventory work.
# Connect to Azure
Connect-AzAccount

# Basic Arc server inventory query
$Query = @"
resources
| where type == "microsoft.hybridcompute/machines"
| project name, resourceGroup, location,
    connectionStatus = properties.status,
    agentVersion = properties.agentVersion,
    lastStatusChange = properties.lastStatusChange,
    osName = properties.osName,
    osVersion = properties.osVersion
| order by name asc
"@

# Execute the query
$Results = Search-AzGraph -Query $Query -UseTenantScope
$Results
Extension Status Across Fleet
Extensions are separate resources linked to your Arc servers. You'll find data collection rule associations, Azure Monitor agents, security extensions, and their installation states.
# Query all Arc server extensions
$ExtensionQuery = @"
resources
| where type == "microsoft.hybridcompute/machines/extensions"
| extend serverName = split(id, '/')[8]
| project serverName,
    extensionName = name,
    extensionType = properties.type,
    publisher = properties.publisher,
    status = properties.provisioningState,
    version = properties.typeHandlerVersion
| order by serverName, extensionName
"@

$Extensions = Search-AzGraph -Query $ExtensionQuery -UseTenantScope
$Extensions
Azure Advisor Recommendations for Arc Servers
The advisorresources table contains Azure Advisor recommendations, including important notifications when Arc agents need updates or have configuration issues.
# Query Azure Advisor recommendations for Arc agent updates
$AdvisorQuery = @"
advisorresources
| where type == 'microsoft.advisor/recommendations'
| where properties.category == 'HighAvailability'
| where properties.shortDescription.solution == 'Upgrade to the latest version of the Azure Connected Machine agent'
| project
        id,
        JoinId = toupper(properties.resourceMetadata.resourceId),
        ["Server Name"] = tostring(properties.impactedValue),
        ["Current Agent Version"] = tostring(properties.extendedProperties.installedVersion),
        ["Expected Agent Version"] = tostring(properties.extendedProperties.latestVersion)
| join kind=leftouter(
    resources
    | where type == 'microsoft.hybridcompute/machines'
    | project
        machineId = toupper(id),
        status = tostring (properties.status)
    ) on $left.JoinId == $right.machineId
| where status != 'Expired'
| summarize by ["Server Name"], ["Current Agent Version"], ["Expected Agent Version"]
"@

$AdvisorRecommendations = Search-AzGraph -Query $AdvisorQuery -UseTenantScope
$AdvisorRecommendations
Defender for Cloud Data in ARG
This is where people get confused. You enable Defender for Servers P1 or P2 in the Azure portal (portal.azure.com), and you can view this security data through multiple interfaces: the Defender for Cloud section in the Azure portal, the unified Defender XDR portal at security.microsoft.com, and programmatically through Azure Resource Graph. The same security assessment data exists in ARG's securityresources table, giving you API access for automation and reporting.
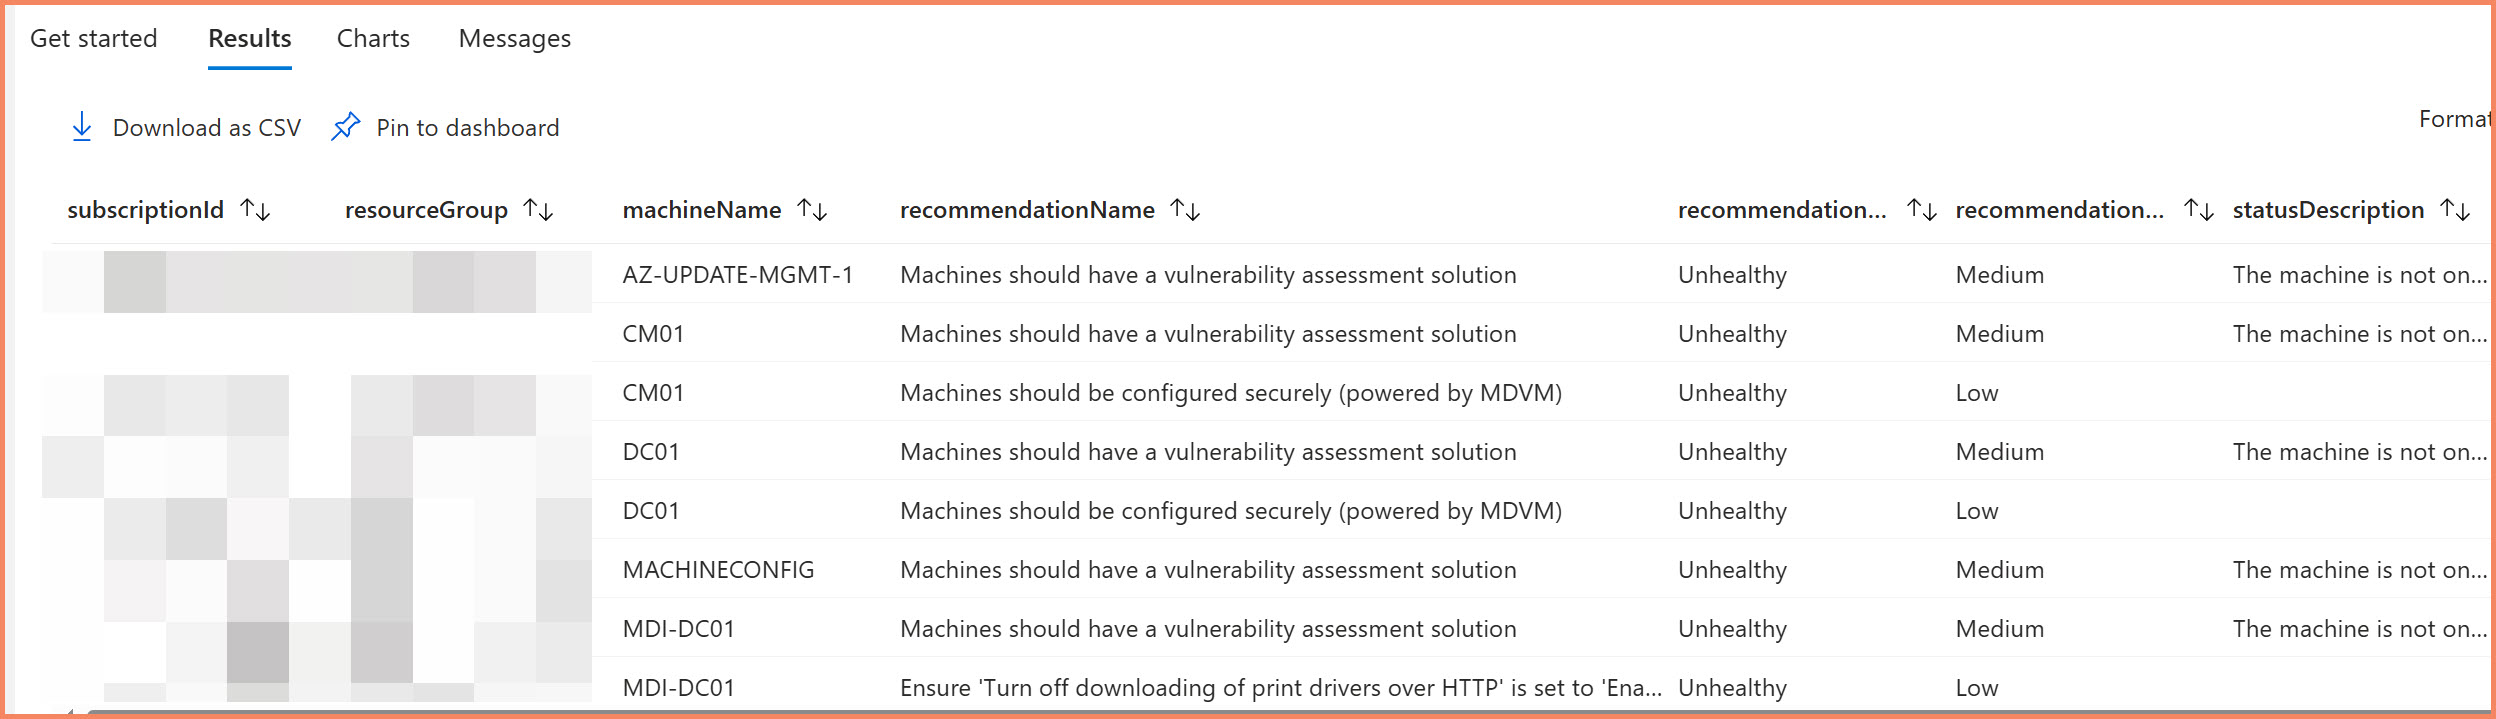
Security Assessments and Recommendations
Security assessments from Defender for Cloud appear in the securityresources table in Resource Graph. This gives you programmatic access to the same security data you see in the portals, but through ARG queries instead of navigating through multiple portal interfaces.
# Query security assessments for Arc servers - shows WHICH machines have issues
$SecurityQuery = @"
securityresources
| where type == "microsoft.security/assessments"
| where properties.resourceDetails.ResourceType =~ "microsoft.hybridcompute/machines"  // Arc machines only
| extend
    machineName = tostring(properties.resourceDetails.ResourceName),
    machineId = tostring(properties.resourceDetails.Id),
    resourceGroup = tostring(split(tostring(properties.resourceDetails.Id), "/")[4]),
    subscriptionId = tostring(split(tostring(properties.resourceDetails.Id), "/")[2]),
    recommendationName = tostring(properties.displayName),
    recommendationState = tostring(properties.status.code),
    statusDescription = tostring(properties.status.description),
    recommendationSeverity = tostring(properties.metadata.severity),
    remediationDescription = tostring(properties.metadata.remediationDescription),
    portalLink = tostring(properties.links.azurePortal)
| where recommendationState in ("Healthy", "Unhealthy")  // Remove NotApplicable assessments
| order by machineName, recommendationSeverity desc
"@

$SecurityAssessments = Search-AzGraph -Query $SecurityQuery -UseTenantScope
$SecurityAssessments
properties.resourceDetails.ResourceType to filter directly for Arc machines, which is much more efficient than parsing resource IDs. We also filter out "NotApplicable" assessments to focus on actionable items. The result shows which specific Arc servers have security issues with full context for remediation.
Advanced Correlation Example: Multi-Table Analysis
Here's what becomes possible when you understand how to correlate data across multiple Resource Graph tables. This example shows building a comprehensive Defender for Cloud coverage report:
| Table Used | Data Retrieved | Purpose |
|---|---|---|
| securityresources | Defender for Servers pricing tiers | Which subscriptions have P1/P2 enabled |
| resourcecontainers | Subscription names and IDs | Human-readable subscription context |
| resources | Arc servers + Azure VMs + Extensions | Machine inventory and MDE extension status |
What you get from this correlation:
- MDE Coverage Analysis - Percentage of Arc servers with Defender for Endpoint extensions installed
- Subscription-level Security Posture - Which subscriptions have gaps between Defender licensing and actual deployment
- Cross-Platform Visibility - Combined view of Azure VMs and Arc servers in security context
- Executive Reporting - Coverage percentages and deployment gaps for management dashboards
securityresources, resourcecontainers, and resources tables, you can build comprehensive security coverage reports that show licensing vs. actual deployment gaps across your entire hybrid infrastructure. This type of analysis is impossible through individual service portals - it requires the cross-service correlation that Resource Graph provides.
Log Analytics Workspaces: Your Operational Data Hub
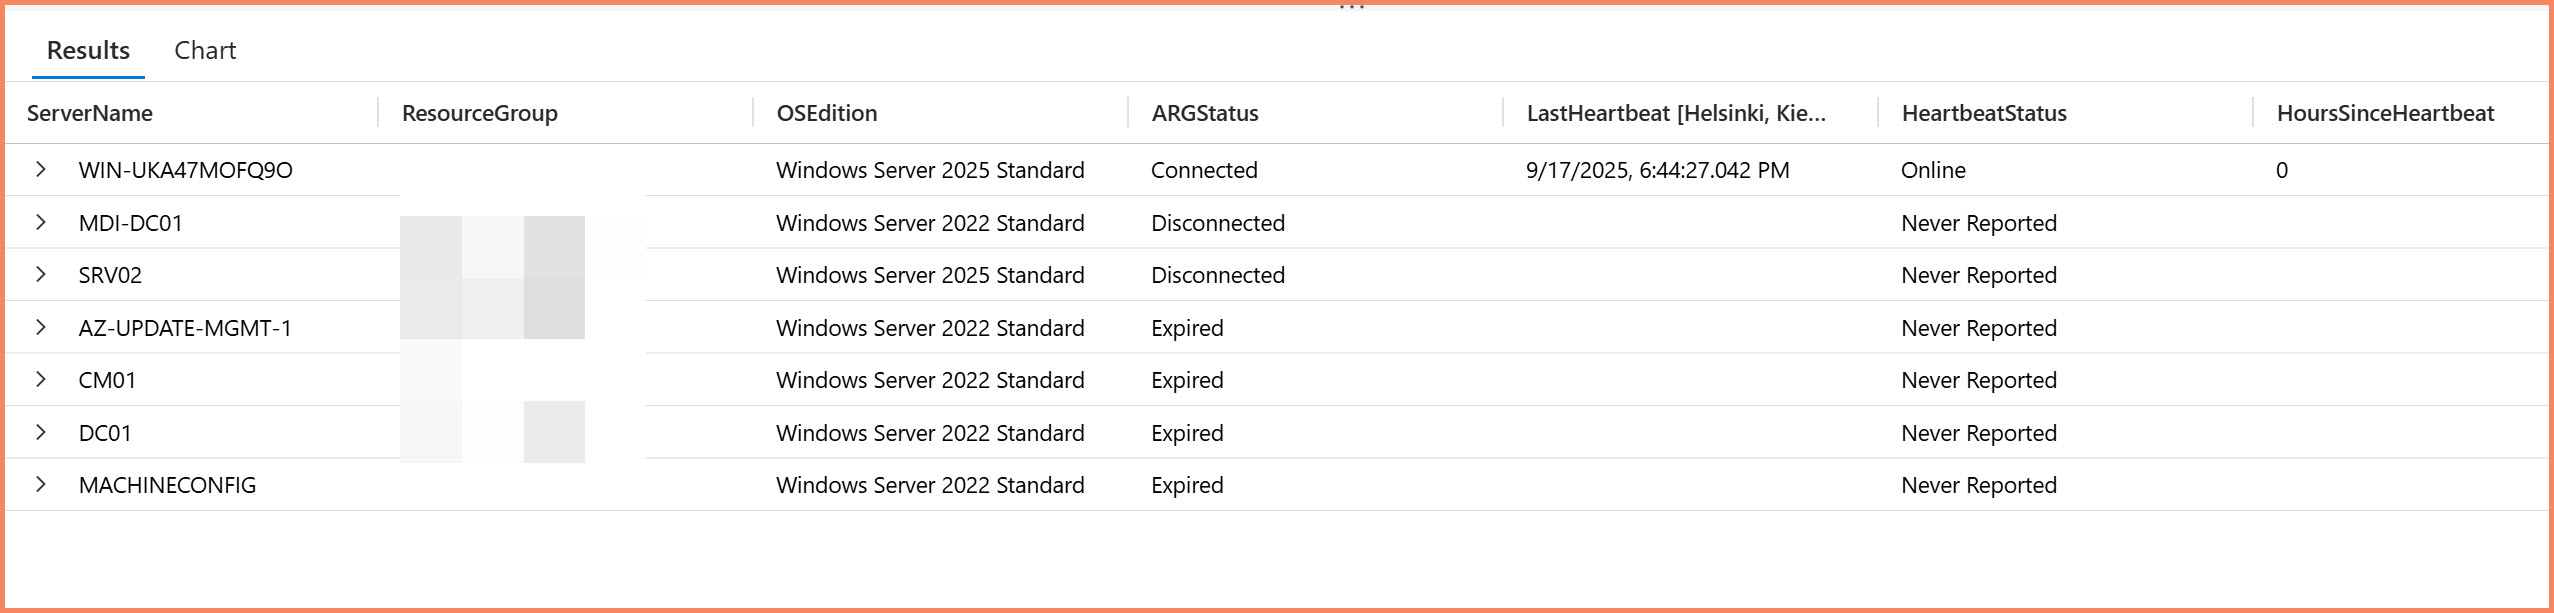
Log Analytics stores your operational telemetry, performance data, and activity logs. The ARG("") function lets you query Resource Graph data directly within Log Analytics KQL queries, joining inventory data with operational logs in the same query.
hint.remote parameters often fail. Use hint.remote for reliable cross-service joins.
Reference: Microsoft documentation on cross-service considerations.
// ARG() join using hint.remote for Arc server heartbeat correlation
arg("").Resources
| where type == "microsoft.hybridcompute/machines"
| project ServerName = name, OSEdition = tostring(properties.osSku),
    ARGStatus = tostring(properties.status), ResourceGroup = resourceGroup
| join hint.remote=right kind=leftouter (
    Heartbeat
    | where TimeGenerated > ago(7d)  // Look back 7 days
    | summarize LastHeartbeat = max(TimeGenerated), HeartbeatCount = count() by Computer
) on $left.ServerName == $right.Computer
| extend DaysSinceHeartbeat = iff(isnotnull(LastHeartbeat), datetime_diff('day', now(), LastHeartbeat), int(null))
| extend HoursSinceHeartbeat = iff(isnotnull(LastHeartbeat), datetime_diff('hour', now(), LastHeartbeat), int(null))
| extend HeartbeatStatus = case(
    isnull(LastHeartbeat), "Never Reported",
    HoursSinceHeartbeat <= 1, "Online",
    HoursSinceHeartbeat <= 24, strcat("Offline ", HoursSinceHeartbeat, "h"),
    DaysSinceHeartbeat <= 7, strcat("Offline ", DaysSinceHeartbeat, " days"),
    "Offline > 7 days"
)
| project ServerName, ResourceGroup, OSEdition, ARGStatus, HeartbeatStatus,
    LastHeartbeat, HoursSinceHeartbeat, HeartbeatCount
| order by HoursSinceHeartbeat desc
Azure Activity Logs in Log Analytics
Azure Activity Logs can be configured to flow into your Log Analytics workspace, giving you operational context about what's happening with your Arc servers. Note that Activity Logs are not routed automatically - you must configure this manually through the Azure portal, Azure Policy, PowerShell, or CLI.
Agent Installation and Health Events
AzureActivity
| where OperationNameValue == "MICROSOFT.HYBRIDCOMPUTE/MACHINES/EXTENSIONS/WRITE" and ActivityStatusValue == "Failure"
| extend Properties = (parse_json(Properties))
| extend Server = toupper(split(Properties.resource,"/")[0])
| extend ["Extension Name"] = split(Properties.resource,"/")[1]
| extend User = Properties.caller
| extend ["Resource Group"] = Properties.resourceGroup
| extend ["Subscription ID"] = Properties.SubscriptionId
| extend ["IP Address"] = CallerIpAddress
| extend ["Activity Status"] = Properties.activityStatusValue
| project TimeGenerated, Server, User, ['Resource Group'], ["Extension Name"], ['Subscription ID'], ['IP Address'], ["Activity Status"]
| sort by TimeGenerated
Failed Patching Operations
Azure Update Manager patching failures for Arc servers are also logged in Activity Logs. This query helps identify which servers had patching issues and when.
AzureActivity
| where OperationNameValue == "Microsoft.Compute/virtualMachines/installPatches/action" and ActivityStatusValue == "Failed"
| where ResourceProviderValue == "MICROSOFT.HYBRIDCOMPUTE"
| extend Server = Properties_d.resource
| extend ["Resource Group"] = Properties_d.resourceGroup
| extend ["Subscription ID"] = Properties_d.subscriptionId
| project TimeGenerated, Server, ['Resource Group'], ['Subscription ID']
| sort by TimeGenerated
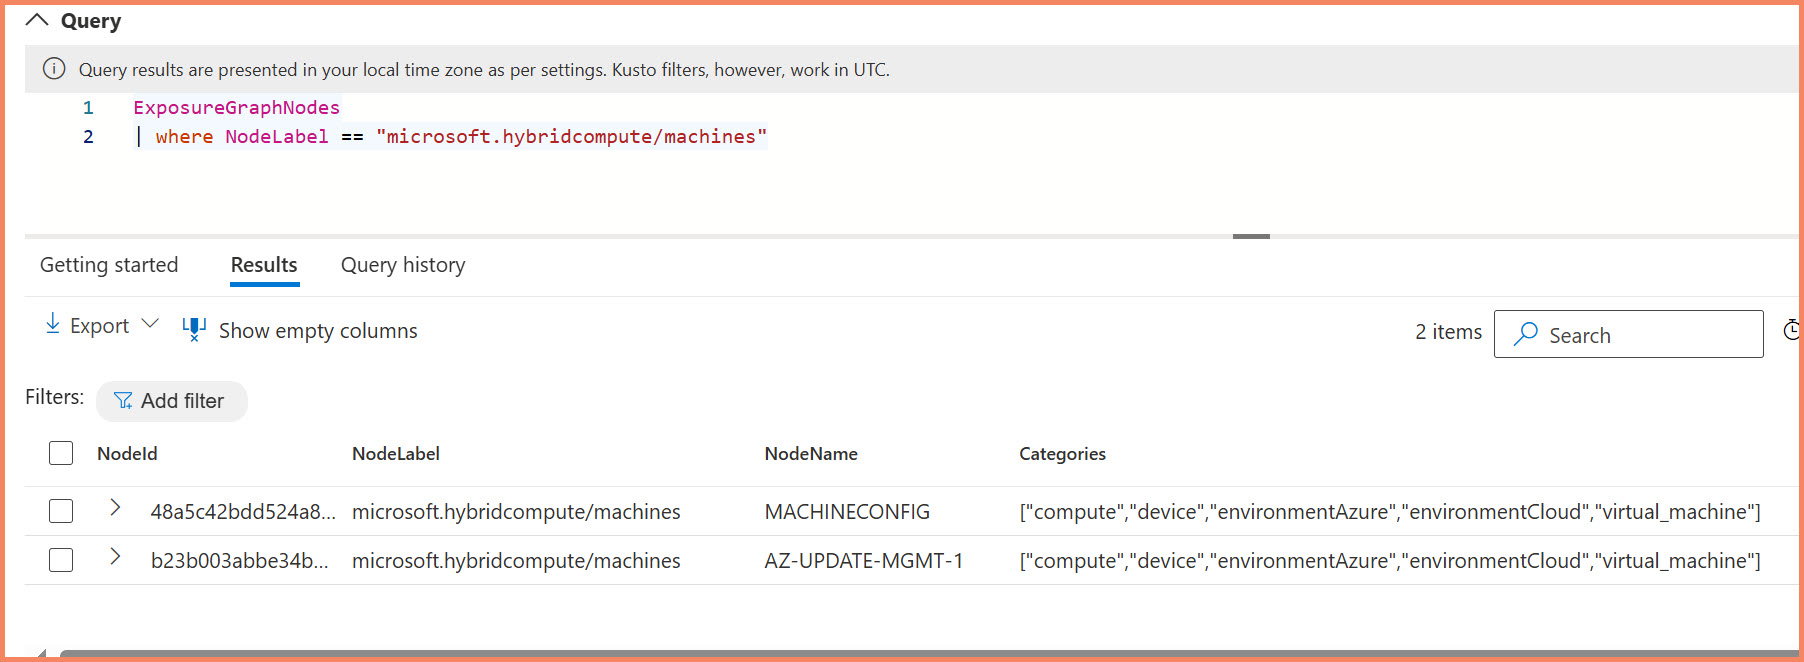
Defender XDR APIs: Security Context for Arc Servers
Defender XDR APIs provide security context through Advanced Hunting tables, focusing on ExposureGraphNodes for comprehensive security intelligence. Arc servers appear as managed devices only when explicitly enrolled in Defender for Endpoint - enabling Defender for Servers P1/P2 alone is insufficient.
- Device properties: OS details, patch levels, TPM status, domain join status
- Security posture: Exposure scores, vulnerability insights (CVSS scores), criticality levels
- Network configuration: Public IPs, RDP/SMB/WinRM service status, security configurations
- Device roles: Domain Controllers, DNS servers, critical infrastructure identification
- Defender for Endpoint data: Onboarding status, sensor health, machine groups, tags
- Azure resources: SQL servers, storage accounts, Log Analytics workspaces, automation accounts
- Defender for Cloud recommendations: Security, management, and auditing recommendations
Challenge: Tables are massive - target specific resource types to avoid timeout errors.
NodeLabel == "microsoft.hybridcompute/machines" - many appear under "microsoft.compute/virtualmachines". Always use EntityIds contains "microsoft.hybridcompute" for reliable identification.
- Official API docs: Microsoft Defender XDR Advanced hunting API
- API automation: See our Defender XDR Security Settings Management guide for automation scripts and required API permissions
- Security best practice: Use certificate-based authentication instead of client ID and secret for production environments
// Find critical infrastructure servers by role
// Available roles: "DomainController", "ExchangeServer", "MicrosoftConfigurationManager",
// "ActiveDirectoryCertificateServicesServer", "AzureADConnectServer", "EntraConnectServer"
ExposureGraphNodes
| where set_has_element(Categories, "device")
| extend DeviceRoles = parse_json(NodeProperties.rawData.deviceRole)
| extend ExposureScoreRaw = NodeProperties.rawData.exposureScore
| extend PublicIPRaw = NodeProperties.rawData.publicIP
| where DeviceRoles contains "DomainController" or DeviceRoles contains "ExchangeServer"
| extend ExposureScore = tostring(ExposureScoreRaw)
| extend PublicIP = tostring(PublicIPRaw)
| project NodeName, DeviceRoles, ExposureScore, PublicIP
High-Risk Azure VMs
Find Azure VMs with high-risk vulnerabilities:
ExposureGraphNodes
| where NodeLabel == "microsoft.compute/virtualmachines"
| extend vulnInsights = parse_json(NodeProperties.rawData.highRiskVulnerabilityInsights)
| extend exposureScore = parse_json(NodeProperties.rawData.exposureScore)
| where vulnInsights.hasHighOrCritical == true
| extend maxCvss = vulnInsights.maxCvssScore
| project NodeName, maxCvss, exposureScore
Remote Services Security Analysis
Analyze remote services security configurations for Azure VMs and Arc servers with rich data:
ExposureGraphNodes
| where NodeLabel == "microsoft.compute/virtualmachines"
| extend remoteServices = parse_json(NodeProperties.rawData.remoteServicesInfo)
| extend smbInfo = remoteServices.smb
| extend rdpInfo = remoteServices.rdp
| extend winrmInfo = remoteServices.winRm
| project NodeName,
    // SMB Security Settings
    SMB_SecuritySignature = tobool(smbInfo.enableSecuritySignature),
    SMB_RequireSignature = tobool(smbInfo.requireSecuritySignature),
    SMB_EncryptData = tobool(smbInfo.encryptData),
    SMB_SMBv1Enabled = tobool(smbInfo.enableSmb1Protocol),
    // RDP Settings
    RDP_AllowConnections = tobool(rdpInfo.allowConnections),
    RDP_NLARequired = tobool(rdpInfo.nlaRequired),
    RDP_ServiceRunning = tobool(rdpInfo.serviceRunning),
    // WinRM Status
    WinRM_ServiceRunning = tobool(winrmInfo.serviceRunning),
    WinRM_StartMode = tostring(winrmInfo.startMode)
Automated Resource Tagging: Use the exposure data to automatically tag Azure Arc resources with security posture and vulnerability information:
- Internet-facing servers get enhanced monitoring and stricter firewall rules
- High vulnerability servers trigger immediate patching workflows
- Critical infrastructure (DCs, Exchange) receives priority security attention
- Reporting and dashboards track security posture improvements over time
Practical Examples: How to Actually Connect and Query
Prerequisites
Before diving into the examples, ensure you have the required PowerShell setup:
PowerShell Version: PowerShell 7 (recommended) or PowerShell 5.1 minimum
Required Azure PowerShell Modules:
Az.ResourceGraph- For querying Azure Resource GraphAz.OperationalInsights- For Log Analytics workspace queriesAz.Accounts- For Azure authentication
Install-Module -Name Az.ResourceGraph, Az.OperationalInsights, Az.Accounts -Force
Defender XDR API Access: Pure REST API calls only - no PowerShell module available.
Handling the 1000-Record Limit: Pagination Function
For environments with more than 1000 Arc servers, you need this pagination function to get complete datasets:
function Invoke-AzGraphQueryWithPagination {
    param (
        [Parameter(Mandatory=$true)]
        [string]$Query,

        [Parameter(Mandatory=$false)]
        [int]$PageSize = 1000
    )

    # Initialize variables for pagination
    $Skip = 0
    $AllResults = @()

    do {
        # Execute the query with current pagination settings
        if ($Skip -gt 0) {
            $Response = Search-AzGraph -Query $Query -First $PageSize -Skip $Skip -UseTenantScope
        } else {
            $Response = Search-AzGraph -Query $Query -First $PageSize -UseTenantScope
        }

        # Add response data to all results
        $AllResults += $Response

        # Print progress
        Write-Host "Retrieved $($Response.Count) records, total retrieved: $($AllResults.Count)"

        # Adjust Skip for the next iteration based on the number of records retrieved
        if ($Response.Count -lt $PageSize) {
            break # Exit loop if fewer records than page size were returned, indicating the last page
        } else {
            $Skip += $PageSize
        }

    } while ($true)

    # Return the collected results
    return $AllResults
}

# Use the pagination function for complete inventory
$AllArcServers = Invoke-AzGraphQueryWithPagination -Query $Query
Write-Host "Total Arc servers found: $($AllArcServers.Count)"
Connecting the Dots: Multi-Source Correlation
Why Server Names Don't Match Across Sources
The challenge with multiple data sources is correlating information about the same server. Server names appear differently across sources, and you need robust matching logic that handles case sensitivity, domain suffixes, and different naming conventions.
SERVER01.contoso.com] subgraph ARG[Azure Resource Graph] ARG_Name[server01
lowercase, no domain] ARG_ID["/subscriptions/.../SERVER01"
full resource path] end subgraph LAW[Log Analytics] LAW_Name[SERVER01.contoso.com
FQDN with domain] LAW_Computer[Computer: SERVER01
NetBIOS name] end subgraph XDR[Defender XDR] XDR_Device[DeviceName: SERVER01
NetBIOS name] XDR_ID[DeviceId: abc123...
unique identifier] end Server --> ARG_Name Server --> ARG_ID Server --> LAW_Name Server --> LAW_Computer Server --> XDR_Device Server --> XDR_ID style Server fill:#e1f5fe style ARG fill:#fff3e0 style LAW fill:#e8f5e8 style XDR fill:#fce4ec
- Resource Graph: Machine name as resource name
- Log Analytics: Computer name in log entries
- Defender XDR: Device name in security tables
Building Dashboards with Azure Workbooks
Why Azure Workbooks for Arc Data
Azure Workbooks provide the best native integration between Resource Graph and Log Analytics data. You can build correlation views that weren't possible before the ARG connector. More importantly, workbooks support multiple data source connectors that let you combine Arc data from different sources in a single visualization.
Building workbooks isn't easy. First, figure out who is going to consume it and what is important for that target audience. Second, understand where that data lives and build the KQL queries for those specific needs. Data mining takes time, and designing the layout takes time too.
Don't start building workbooks immediately - take the time to figure out the what, who, and where. In Azure Workbooks you can add different elements, coloring, conditions, dropdowns, and many other things. It takes time to learn all these capabilities.
My recommendation: see other examples that Microsoft offers, understand how they've designed them, and try to replicate those yourself. Best way to learn is through examples and reading the official documentation.
Data Source Connectors Available
When creating workbook queries, you have access to multiple data source connectors. This is where the real power lies for Arc server monitoring:
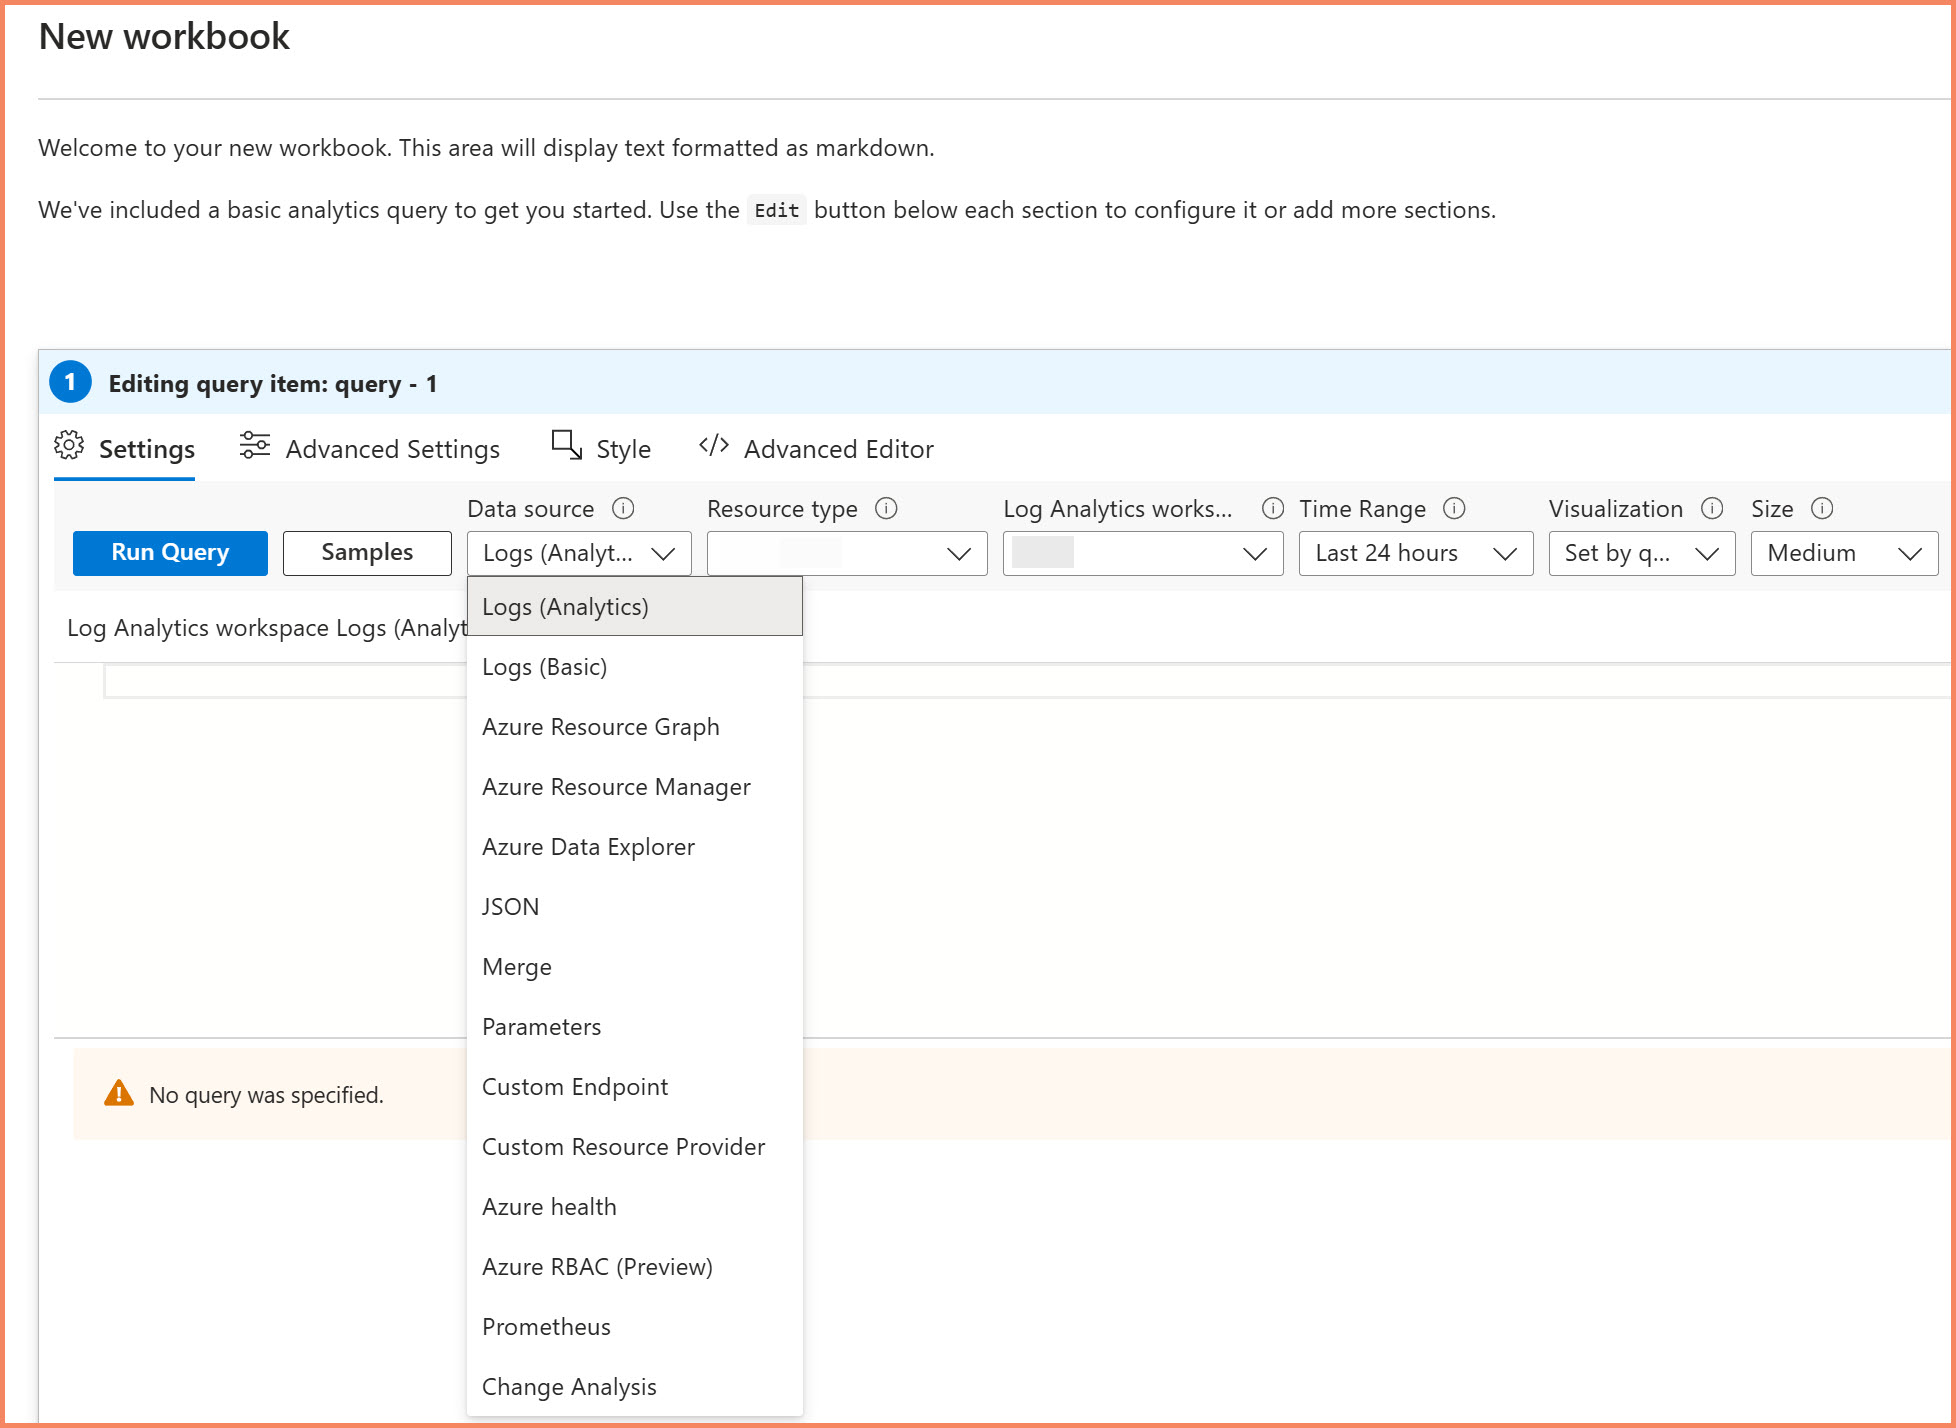
- Azure Resource Graph: Direct access to ARG tables without pagination limits
- Logs: Your Log Analytics workspace data (Heartbeat, Update, etc.)
Reference: Azure Workbooks data sources documentation
Workbook Customization Capabilities
Once you add your queries, Azure Workbooks provide extensive customization options through column settings. You can configure thresholds, icons, colors, and conditional formatting to make important information easier to track visually.
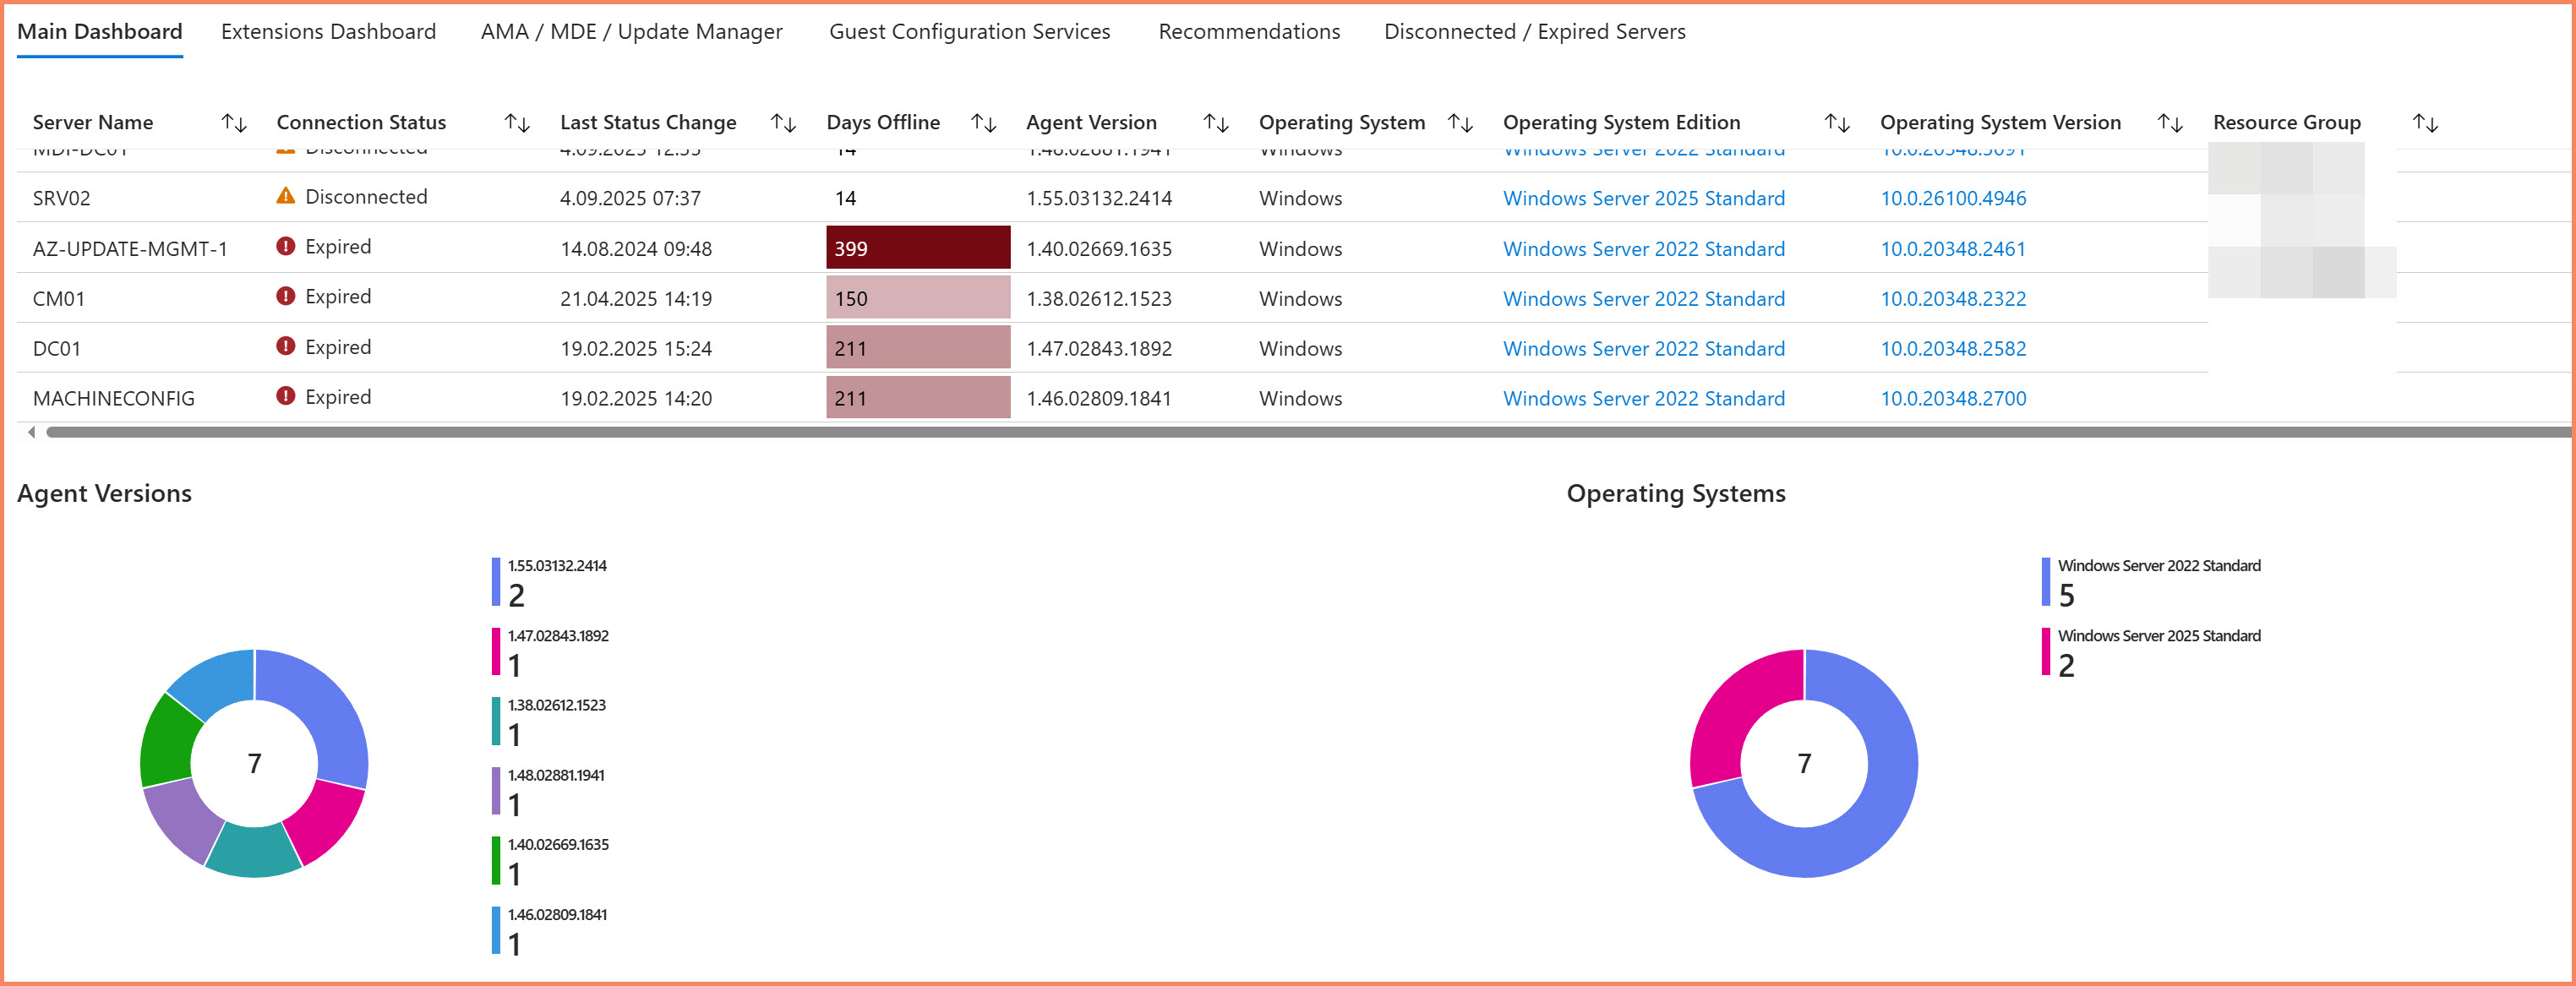
- Icons for status columns - Connection status with visual indicators
- Color thresholds - Days offline with color coding (green = good, red = critical)
- Conditional formatting - Highlight cells based on values
- Custom column rendering - Transform data display without changing queries
These visual enhancements make it much easier to spot critical issues, but designing effective layouts takes time and planning.
ARG Function Integration & Templates
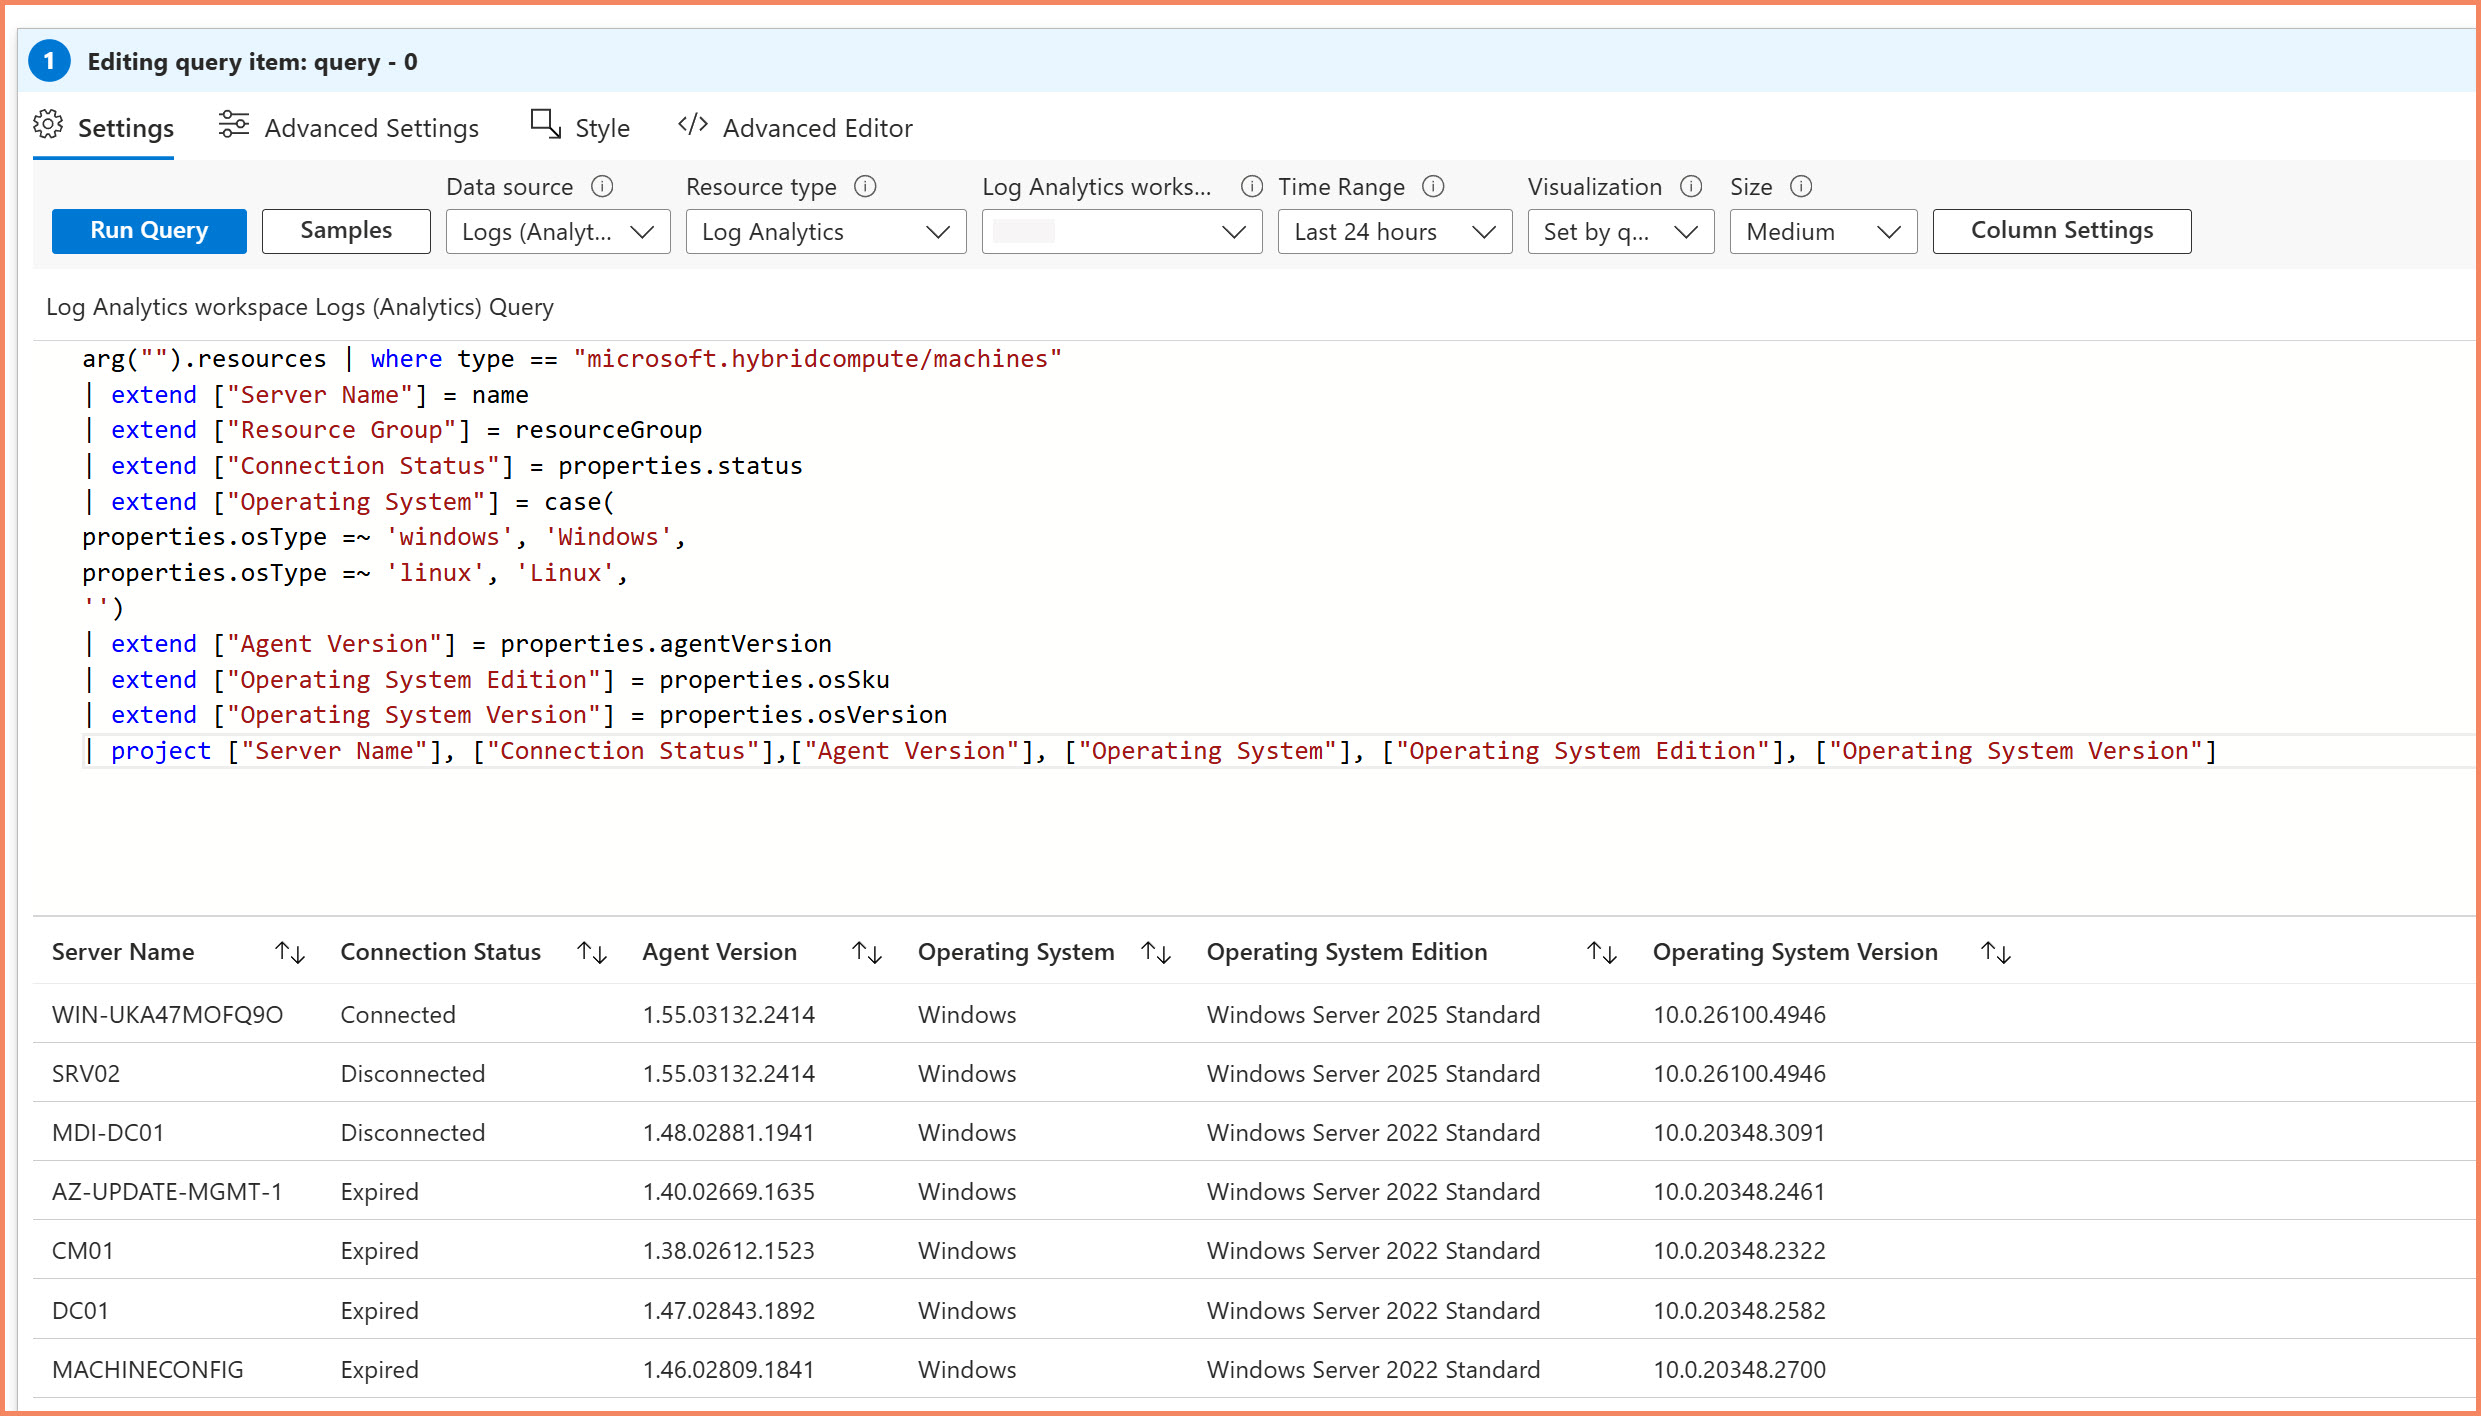
The ARG("") function lets you combine Resource Graph inventory data with operational logs in the same visualizations. Set your data source to "Logs" and use ARG queries within your KQL - particularly powerful for compliance reporting and operational dashboards.
Templates: Save workbooks as templates and share across your organization. Export configurations as JSON templates for Azure Resource Manager deployment, standardizing Arc server monitoring across teams and environments.
Key Takeaways
Know where your data lives. If you're starting with Azure and hybrid cloud, understanding data location is critical. Microsoft keeps moving things around, so you need to stay aware of where Arc server data actually exists versus where marketing says it should be.
Master correlation challenges. Server names appear differently across sources. Some tables use full resource IDs, others use different case formats. Build robust matching logic and normalize your data - you can't assume exact string matches work everywhere.
Leverage the power of multiple sources. Once you understand where your data lives, you can harvest information from all three sources to build custom vulnerability management systems, CMDB solutions, or dashboards that serve your specific needs rather than being limited by Microsoft's portal constraints.
Summary: Making Sense of Scattered Arc Data
When you deploy Azure Arc for Servers, your data doesn't live in one convenient location. Instead, it's distributed across three main sources, each serving specific purposes:
Azure Resource Graph serves as your digital library for ALL Azure resources, including Arc servers. Here you'll find inventory data, configuration status, extension states, and even Defender for Cloud security assessments - not where you'd expect them in the Defender portal.
Log Analytics Workspaces handle your operational telemetry, heartbeat data, activity logs, and custom monitoring data. The new ARG("") function lets you correlate this with Resource Graph data, though it comes with significant limitations that require realistic expectations.
Defender XDR APIs provide security context through Advanced Hunting tables like ExposureGraphNodes, but only when your Arc servers are explicitly enrolled in Defender for Endpoint - enabling Defender for Servers P1/P2 isn't enough.
This is the current reality of working with Azure Arc data. Microsoft keeps moving security features around - Sentinel integration, Defender for Cloud elements shifting to different portals, the new Sentinel data lake for long-term security data storage, and exposure management data appearing in multiple places. Each announcement promises "unified" security operations, but each creates new data locations you need to understand. You need to know where your data lives to be effective.
Understanding how to work with this distributed model effectively separates successful Arc implementations from ones that struggle with basic visibility and automation. The learning curve is real, but mastering these data sources gives you the foundation to build solutions that Microsoft's limited portal views simply can't provide.
About the Author

🎯 Specializations
- Microsoft Defender XDR
- Microsoft Sentinel SIEM & SOAR
- Microsoft Entra ID (Azure AD)
- Microsoft Intune
- Azure Arc Services
- Azure Log Analytics
- Azure Automation
- Hybrid Cloud Management