The Shift from MMA to Data Collection Rules
For years, the Microsoft Monitoring Agent was one of my favorite things about Azure management. You installed one agent, pointed it at a workspace with a workspace ID and key, enabled solution packs, and everything just worked. Security events, performance counters, custom logs, all configured at the workspace level. It was simply easy. Easy and fast to set up, easy to understand, easy to maintain, and it made selling those solutions easy too.
But that simplicity had a cost. You couldn't be granular about what you collected. If you needed one specific security event ID, you couldn't just collect that one event. You had to pull in a much broader set. Security Events had tiers like "Common" and "All," but no option for "just give me Event ID 5136 and nothing else." The result was collecting far more data than you actually needed, which drove up ingestion costs. The simplicity that made MMA easy to deploy was the same simplicity that made it expensive and inflexible when you needed precision.
Then Microsoft deprecated MMA on August 31, 2024.
The replacement, the Azure Monitor Agent with Data Collection Rules, solves the granularity problem completely. You can now filter down to individual event IDs using XPath queries, collect exactly the performance counters you need at exactly the interval you want, and apply KQL transformations to reshape data before it even reaches your workspace. The architectural improvement is real.
But that power came with a massive increase in complexity. The old model was workspace-level configuration: enable a solution, and every connected agent picks it up automatically. The new model is rule-based: every data source, every destination, every transformation is defined in a separate Data Collection Rule that must be explicitly associated with the machines that use it.
This isn't a minor operational change. It's a complete rethinking of how data collection works. Where you used to have one workspace configuration covering hundreds of servers, you now have individual DCRs, potentially dozens of them, each defining a specific data pipeline.
And in most enterprise environments I work with, it's already out of control. Hundreds of data collection rules spread across multiple Log Analytics Workspaces, and nobody knows anymore where the data is actually ending up or why their ingestion bill keeps growing. If you don't get the architecture and governance right from the start, the sprawl compounds fast, and in larger environments getting it back under control after the fact is a painful, expensive project.
This guide covers what I've learned from implementing and cleaning up DCRs across multiple enterprise environments: the different types, the schemas, the three competing approaches to performance monitoring, and the architectural shift to Azure Monitor Workspace that's going to change how you design monitoring for every new project.
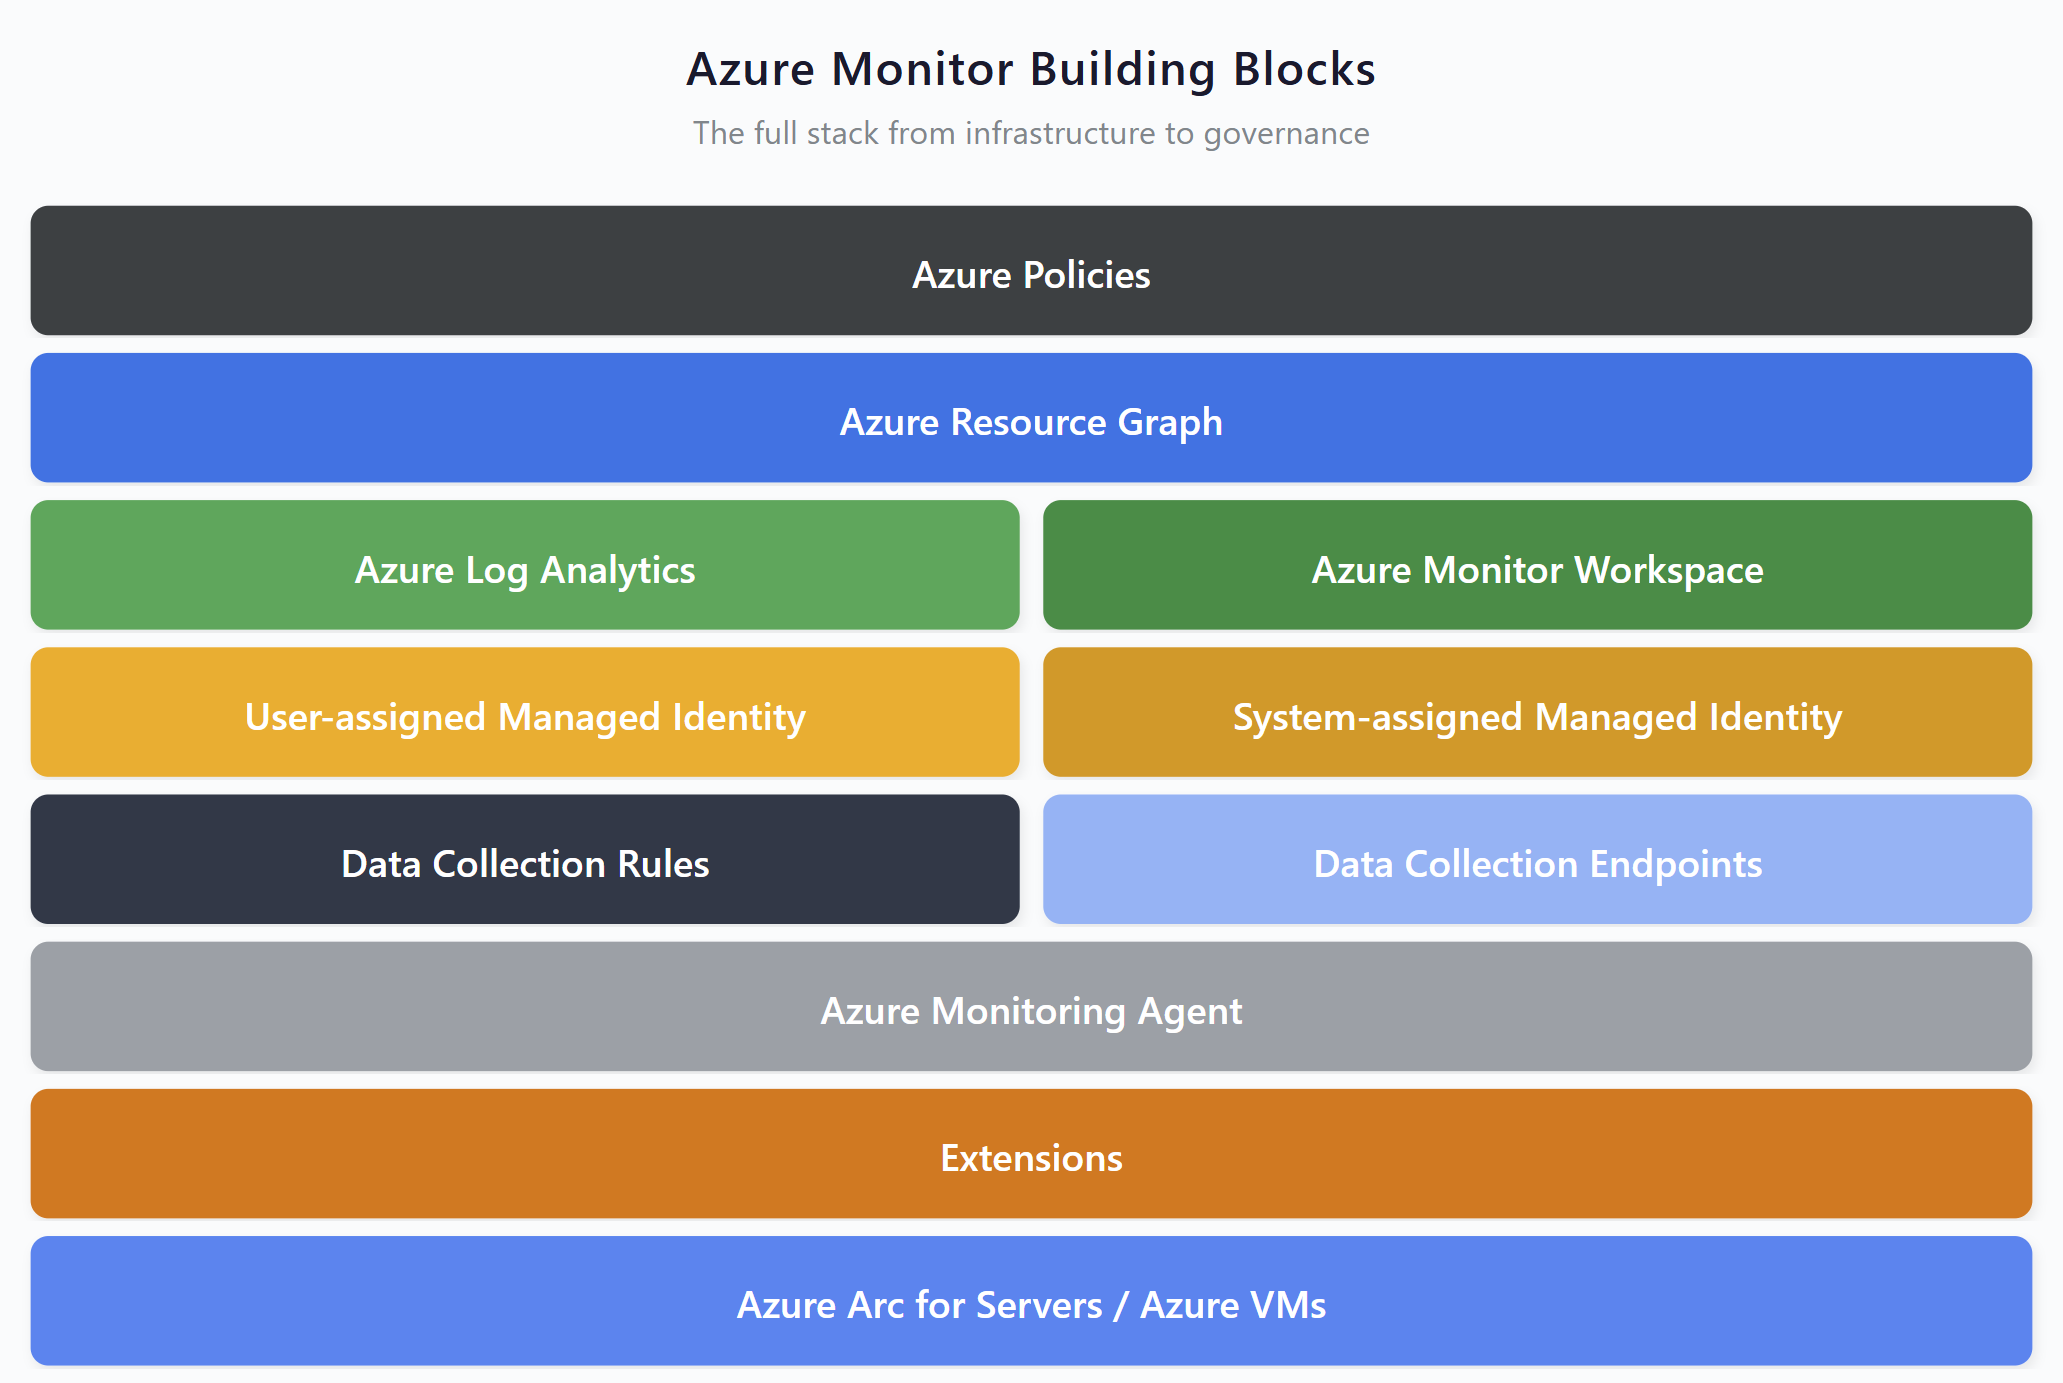
Azure Monitor building blocks — DCRs sit as the configuration layer connecting data sources to destinations
What Data Collection Rules Actually Are
A Data Collection Rule is the configuration layer that sits between your data sources and your destinations. It defines three things: what data to collect, how to process it, and where to send it.
Every DCR is built from the same set of components:
- Data Sources — where the data comes from. This could be Windows Event logs, performance counters, IIS logs, custom application data, or extension-based telemetry.
- Streams — the data pipeline. Each data source type maps to specific predefined streams (like
Microsoft-PerforMicrosoft-SecurityEvent) or custom streams for custom tables. - Destinations — where the data lands. Traditionally this was always a Log Analytics Workspace, but now Azure Monitor Workspace is a second destination type for metrics.
- Data Flows — the wiring that connects streams to destinations, optionally applying KQL transformations along the way.
- Transformations — optional KQL queries that filter, enrich, or reshape data before it reaches the destination.
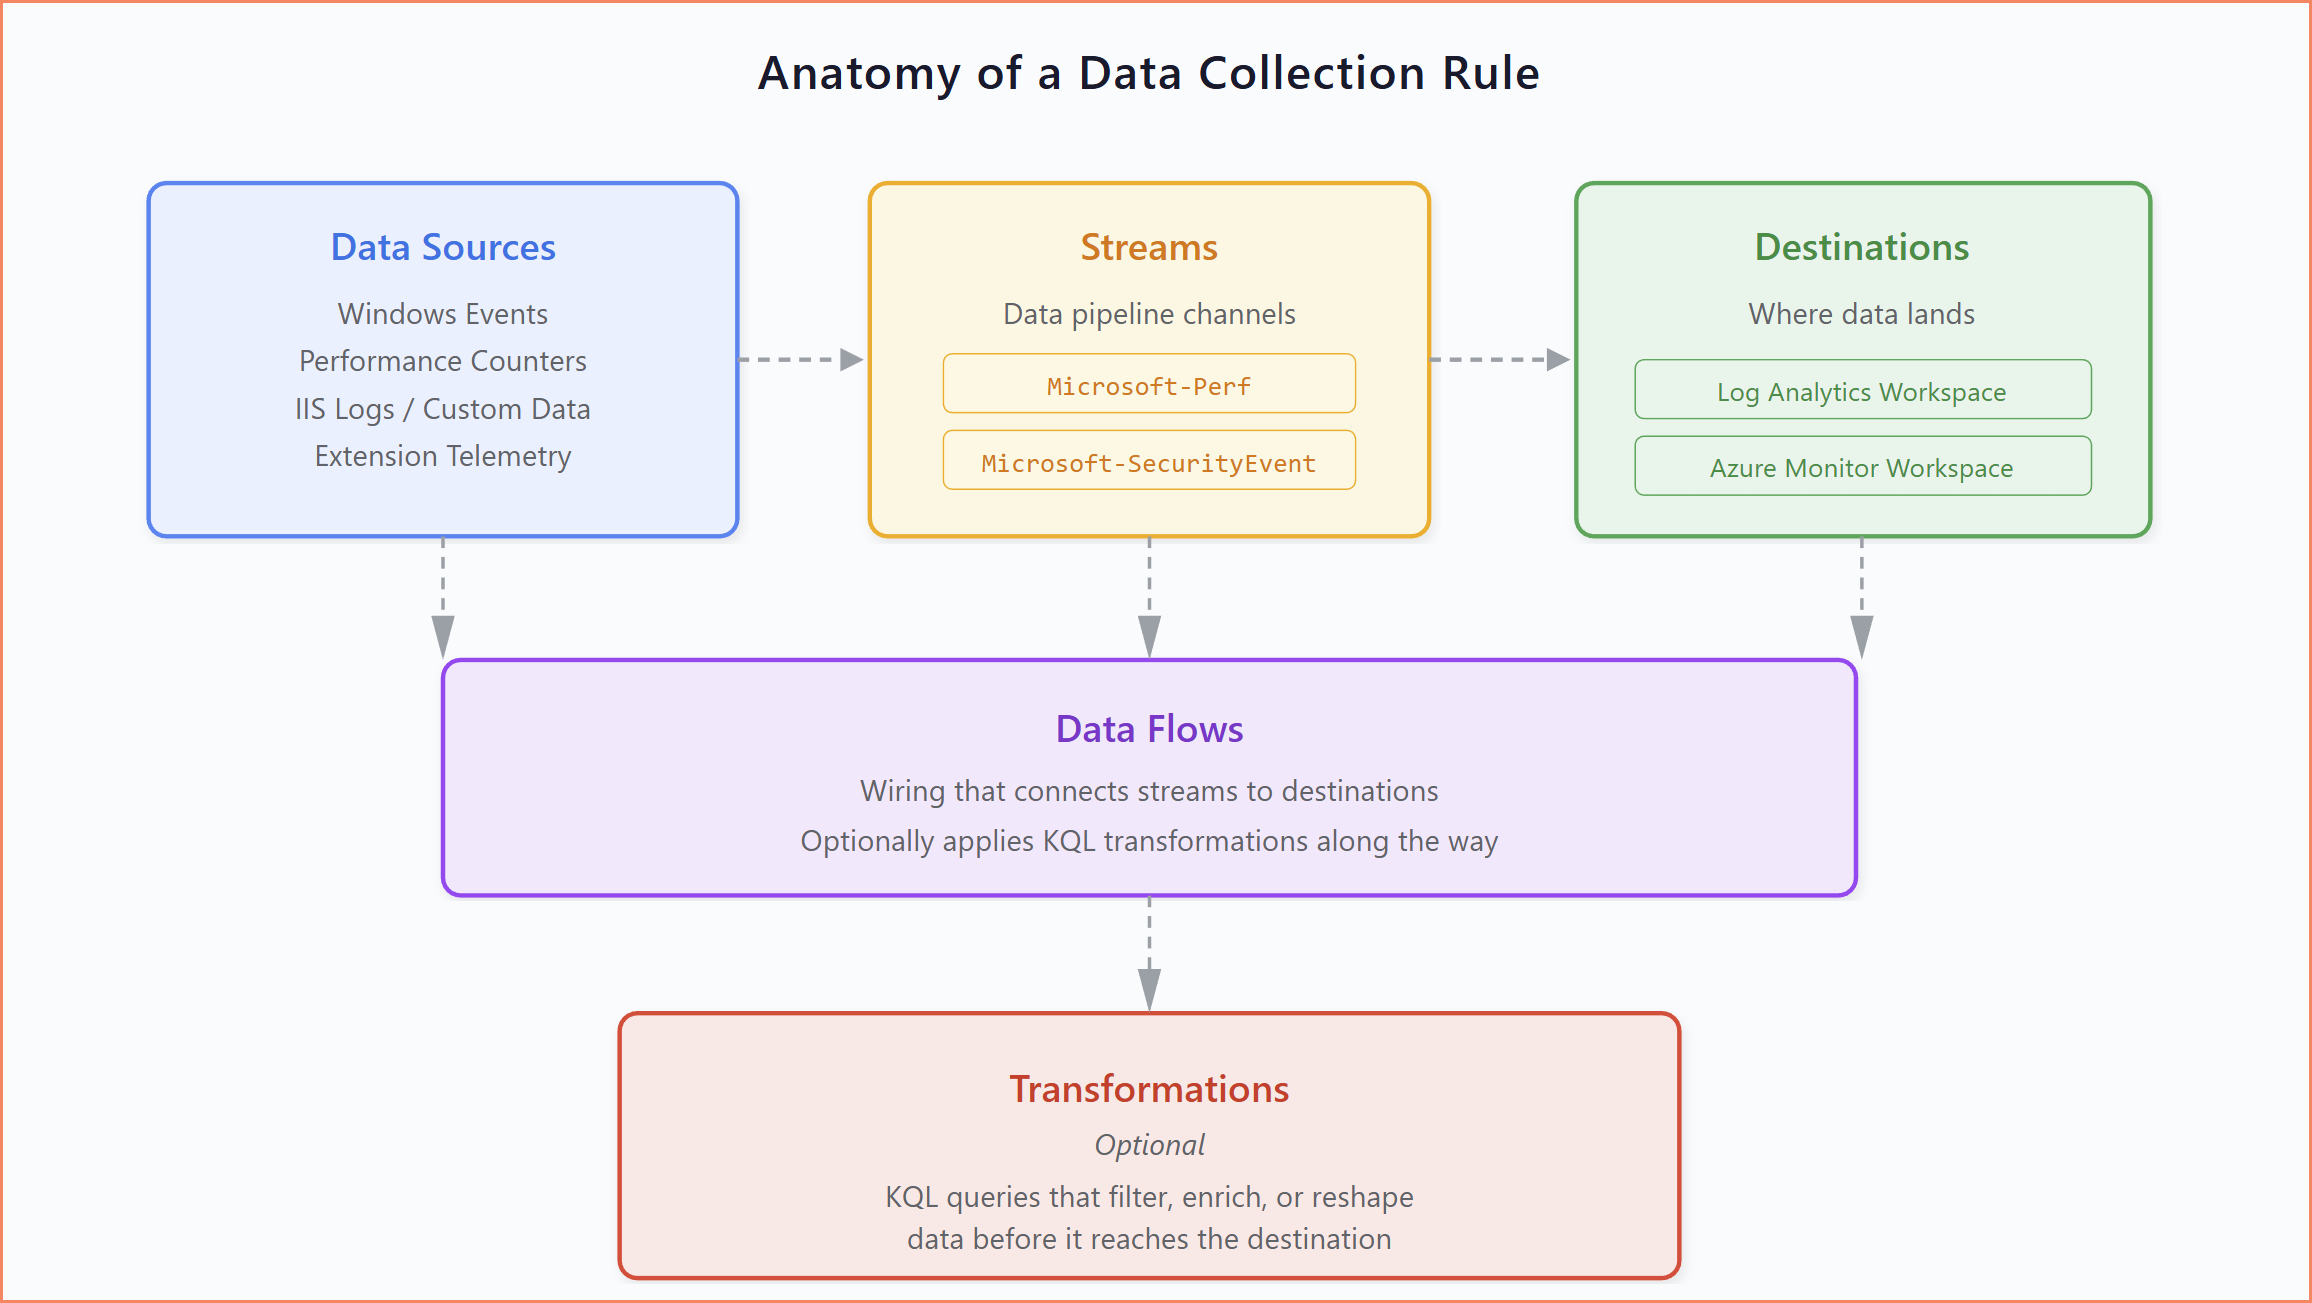
Anatomy of a Data Collection Rule: data sources, streams, data flows, and destinations
The key architectural advantage over MMA is decoupling. MMA had multi-homing where you could point one agent at multiple workspaces (up to four on Windows, Linux didn't support it at all), but the same data went to all of them. With DCRs, a single Azure Monitor Agent can process multiple DCRs simultaneously, each sending different data to different destinations. You get selective routing, not just replication.
The downside is complexity. Every data type you want to collect needs its own DCR (or at least a section within one). You need to understand which DCR types require a Data Collection Endpoint and which don't. You need to know about DCR associations, the link between a rule and the machines that use it. And you need to be deliberate about naming, tagging, and governance from day one, because DCRs multiply fast.
Two Operational Models: Association-Based vs API-Based
There's another fundamental distinction to understand: not all DCRs work the same way. There are two completely different operational models, and understanding the difference is critical, especially when you're auditing your environment and trying to figure out which DCRs are actually in use.
Association-based DCRs are the more common type. The Azure Monitor Agent on a machine reads the DCR configuration and collects data accordingly. For this to work, the DCR must be associated with the target machines. That's the link that tells AMA "use this rule." Windows Event DCRs, performance counter DCRs, IIS log DCRs: these are all association-based. If you open one and see associations, you know which machines are using it.
API-based DCRs work completely differently. There's no agent involved in the collection. Your code (a PowerShell script, an Azure Automation runbook, or a Logic App) authenticates to Azure, gets a bearer token, and pushes data directly to the Data Collection Endpoint using the DCR's immutable ID and stream name. The DCR defines the schema and destination, but it has no associations. No machines are linked to it. The dataSources section is empty.
When you're reviewing DCRs in your environment, the first question should always be: is this association-based or API-based? The answer determines how you verify whether it's active, who's using it, and whether it's safe to modify or remove.
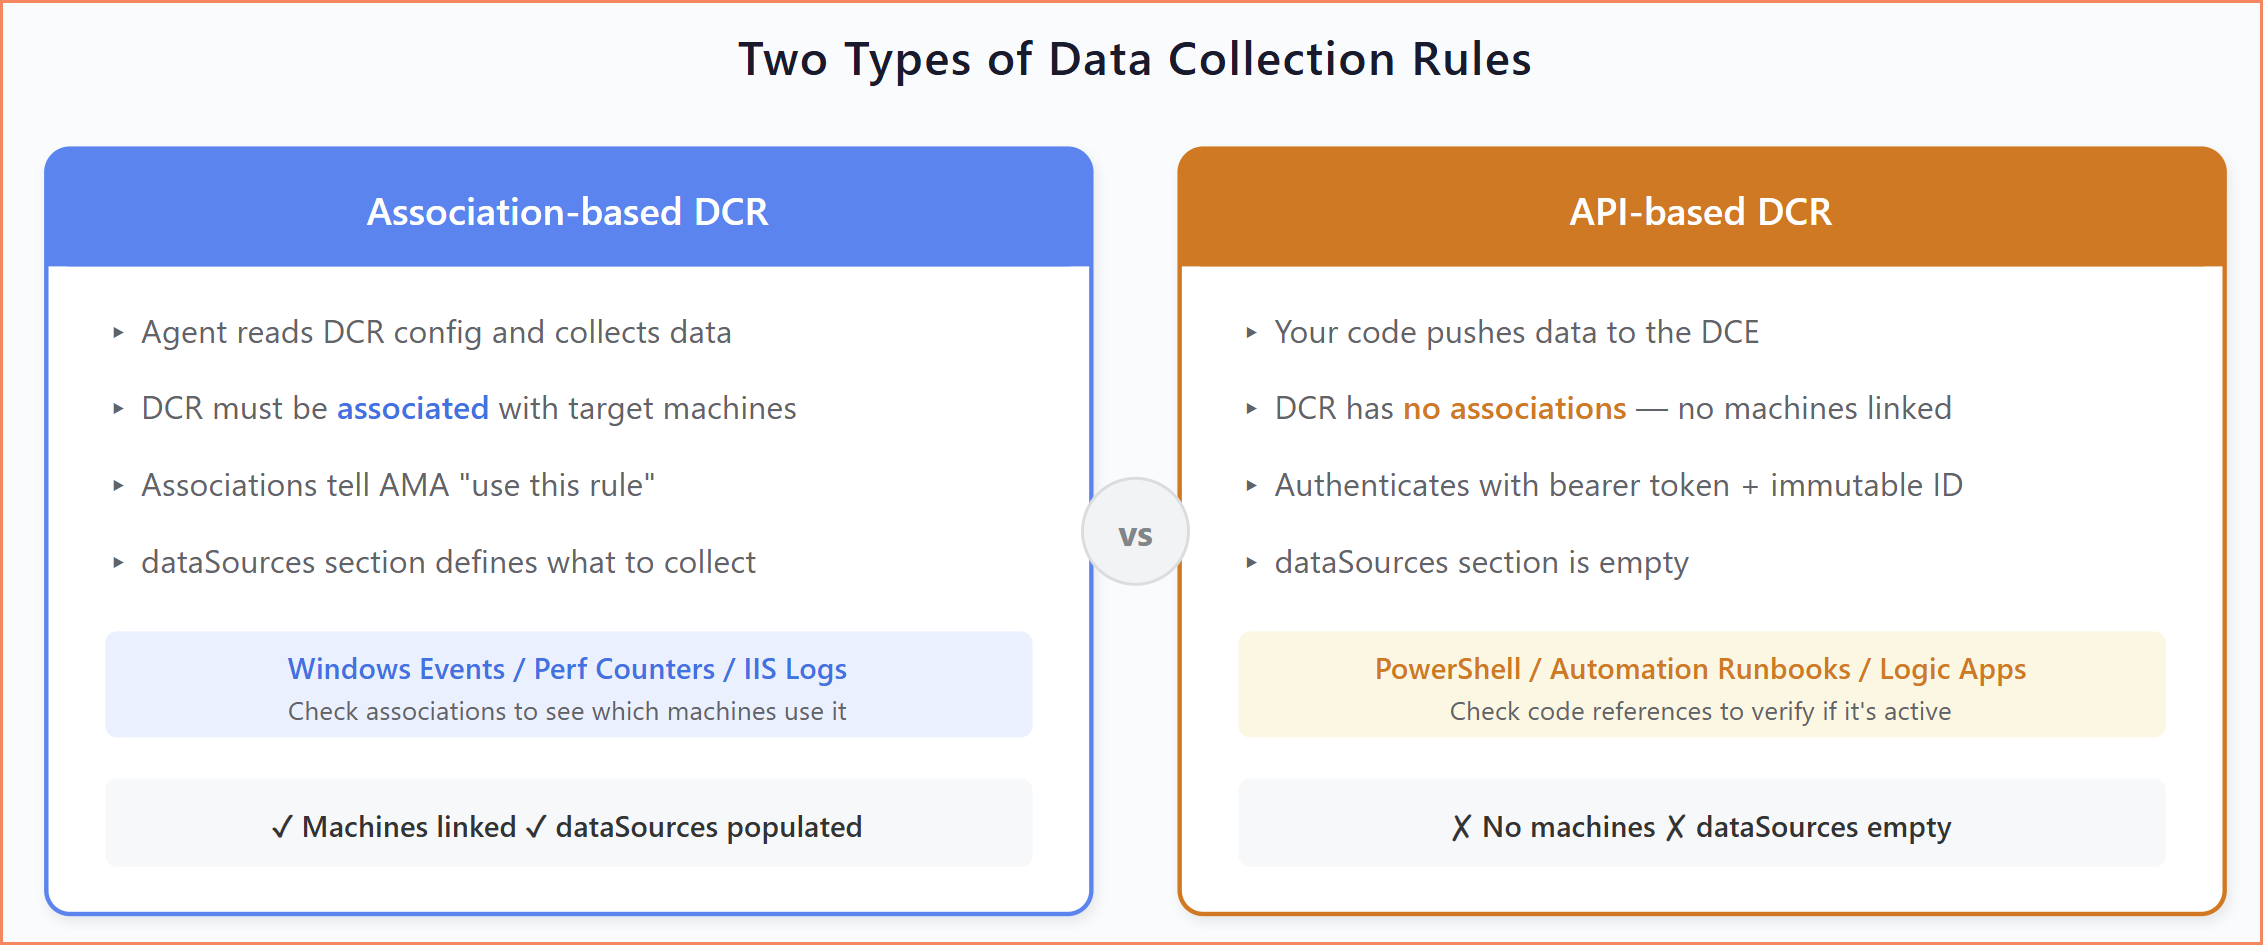
Two operational models: association-based (agent collects) vs API-based (code pushes)
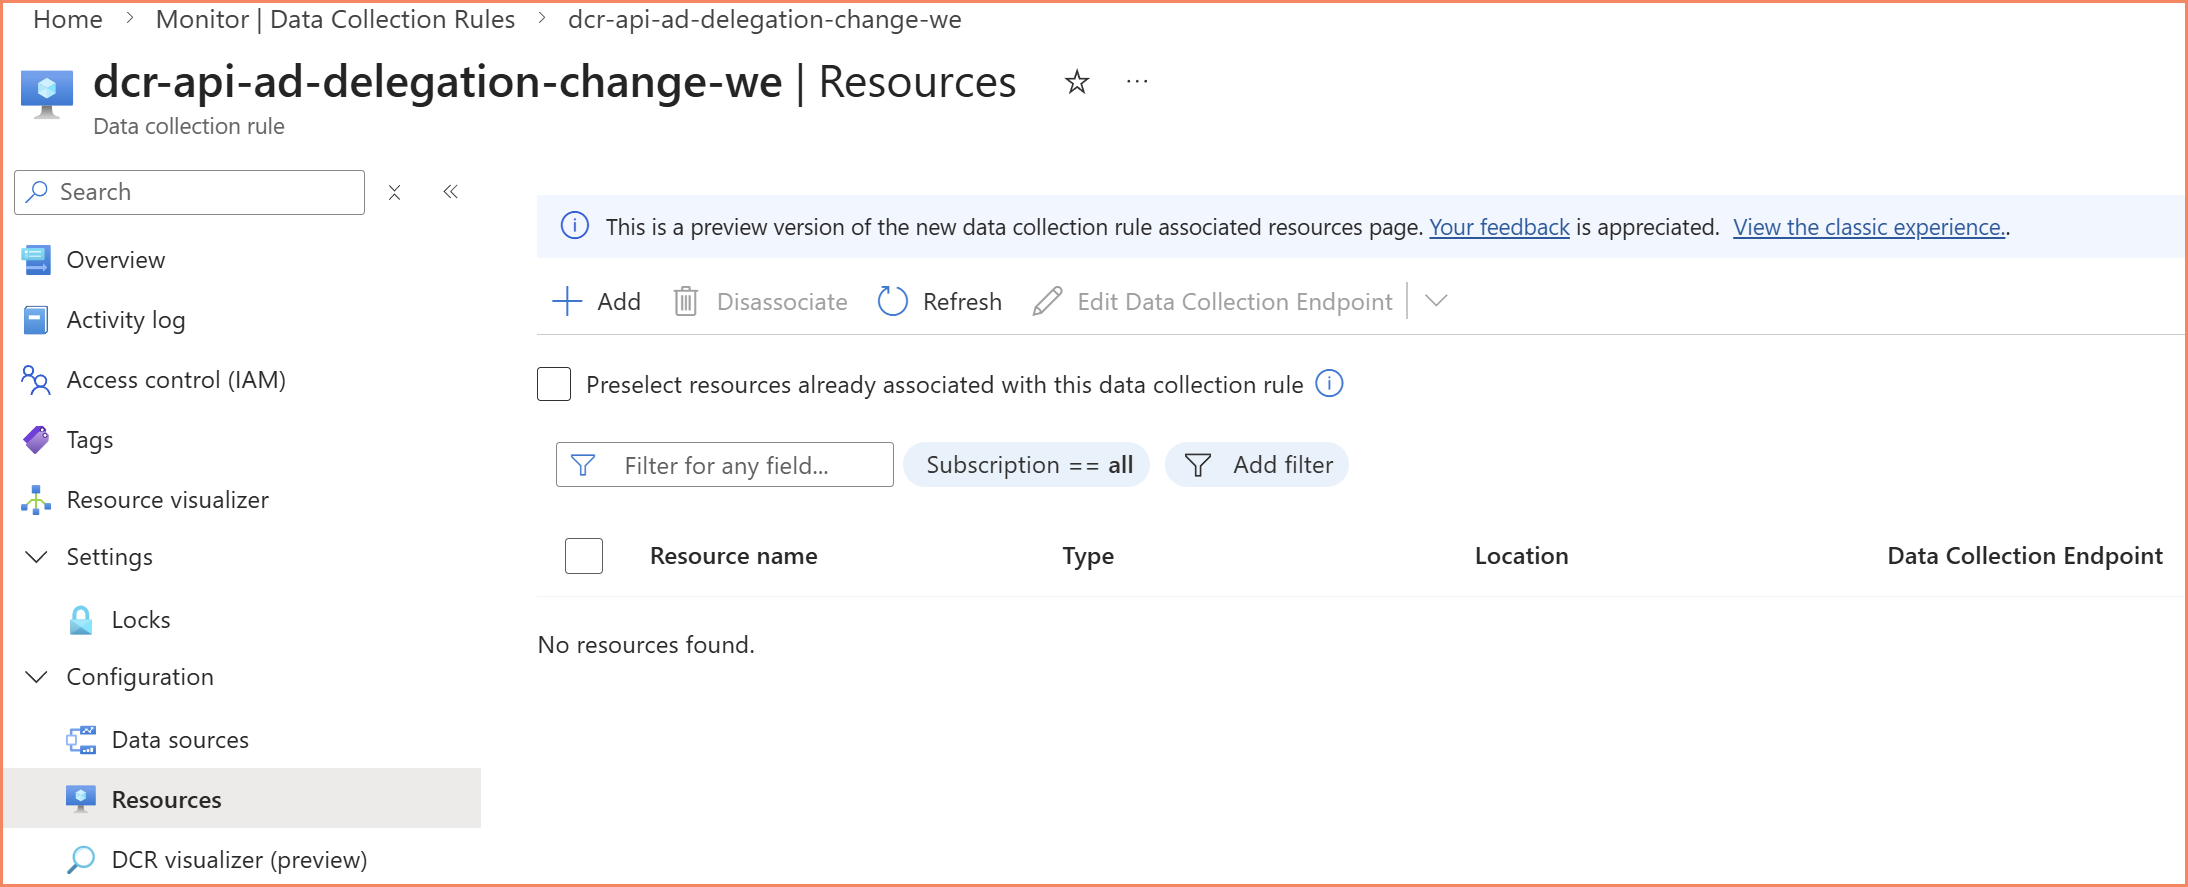
The API-based DCR has zero associations but is still actively receiving data through code
Types of Data Collection Rules
DCRs aren't one-size-fits-all. The schema and configuration requirements change significantly depending on what you're collecting. Here are the types you'll encounter most often.
Windows Event DCRs
The most straightforward DCR type. You define XPath queries to filter which Windows Events to collect, specify a predefined stream like Microsoft-SecurityEvent, and point it at a Log Analytics Workspace.
Key characteristics:
- No Data Collection Endpoint required in standard deployments (only with Private Link)
- Uses predefined streams, so no schema definition is needed
- XPath query syntax for precise event filtering
- Data flows to standard Log Analytics tables (SecurityEvent, WindowsEvent, etc.)
{
    "properties": {
        "dataSources": {
            "windowsEventLogs": [
                {
                    "streams": ["Microsoft-SecurityEvent"],
                    "xPathQueries": [
                        "Security!*[System[(EventID=5136)]]",
                        "Security!*[System[(EventID=4728 or EventID=4732 or EventID=4756)]]"
                    ],
                    "name": "eventLogsDataSource"
                }
            ]
        },
        "destinations": {
            "logAnalytics": [
                {
                    "workspaceResourceId": "/subscriptions/YourSubscriptionId/resourceGroups/YourResourceGroupName/providers/Microsoft.OperationalInsights/workspaces/YourWorkspaceName",
                    "workspaceId": "YourWorkspaceGUID",
                    "name": "YourDestinationName"
                }
            ]
        },
        "dataFlows": [
            {
                "streams": ["Microsoft-SecurityEvent"],
                "destinations": ["YourDestinationName"]
            }
        ]
    },
    "kind": "Windows"
}
This is the type you'll deploy most often for security monitoring and Sentinel integration. The XPath filtering gives you the precision that MMA never had. You can target specific event IDs, event channels, and even event data fields to collect exactly what you need.
Get-WinEvent -FilterXPath to verify you're getting the events you expect. Once you've confirmed the query works locally, move it into your DCR configuration. This saves a lot of trial-and-error in the portal where the feedback loop is much slower.
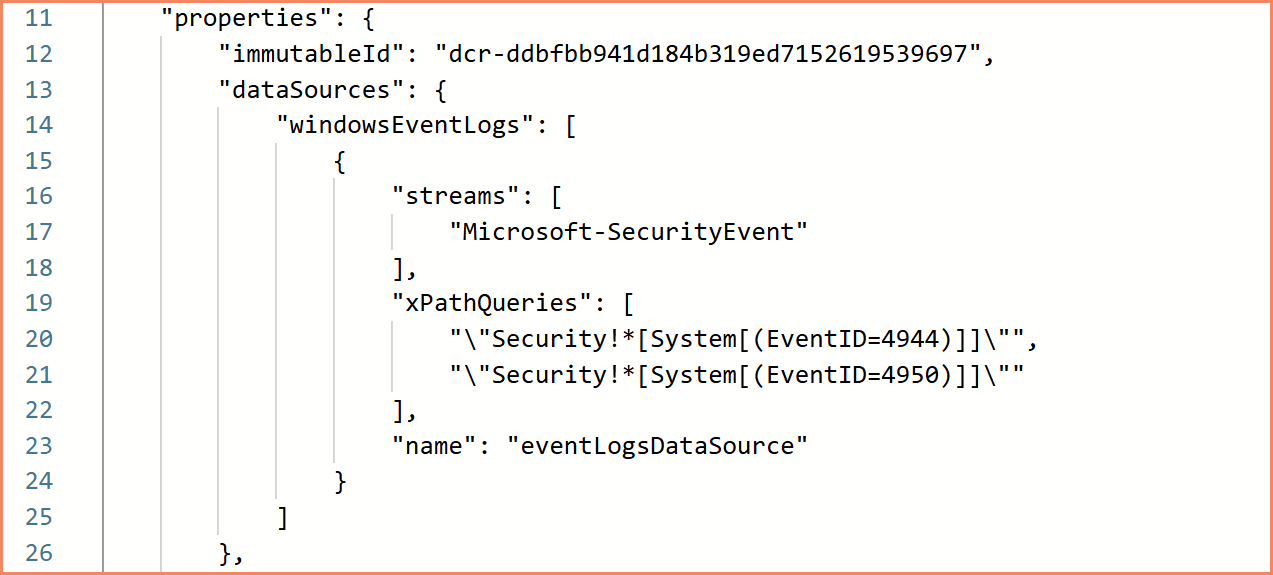
Windows Event DCR configuration — XPath queries for precise event filtering
Custom Table DCRs
I've done many projects that rely on custom table DCRs, and this is a DCR type you will end up with in production. Whether you're collecting Active Directory delegation data, pulling information from Microsoft Graph through Azure Automation, or building any custom monitoring solution that needs its own table. This is how it works.
Custom table DCRs can be both API-based and agent-based. The API-based variant is the more common one. Your scripts or automation push data into Log Analytics through the Data Collection Endpoint. But you can also use agent-based collection with custom text or JSON log files that the AMA picks up from the machine. In both cases, you need a custom table DCR.
Key characteristics:
- Data Collection Endpoint is mandatory, always, even without Private Link
- Stream declarations required: you define the table schema directly in the DCR
- For API-based collection, the data sources section is empty because data comes from API calls, not from an agent
- Supports KQL transformations before data reaches the workspace
{
    "properties": {
        "dataCollectionEndpointId": "/subscriptions/YourSubscriptionId/resourceGroups/YourResourceGroupName/providers/Microsoft.Insights/dataCollectionEndpoints/YourDCEName",
        "streamDeclarations": {
            "Custom-YourTableName_CL": {
                "columns": [
                    { "name": "TimeGenerated", "type": "datetime" },
                    { "name": "Resource", "type": "string" },
                    { "name": "Category", "type": "string" },
                    { "name": "Details", "type": "string" }
                ]
            }
        },
        "dataSources": {},
        "destinations": {
            "logAnalytics": [
                {
                    "workspaceResourceId": "/subscriptions/YourSubscriptionId/resourceGroups/YourResourceGroupName/providers/Microsoft.OperationalInsights/workspaces/YourWorkspaceName",
                    "workspaceId": "YourWorkspaceGUID",
                    "name": "YourDestinationName"
                }
            ]
        },
        "dataFlows": [
            {
                "streams": ["Custom-YourTableName_CL"],
                "destinations": ["YourDestinationName"],
                "transformKql": "source | extend TimeGenerated = now()",
                "outputStream": "Custom-YourTableName_CL"
            }
        ]
    }
}
The empty dataSources section is the giveaway that this is an API-based DCR. Your code authenticates to the Data Collection Endpoint, sends JSON payloads with the DCR's immutable ID and stream name, and the data lands in the custom table. It's more work than the old days of just posting to the workspace data collector API with a workspace key, but the control over schema and transformations makes it worth it.
Ready-Made Custom Table DCR Solutions
Active Directory delegation monitoring, Entra ID security auditing, Group Policy configuration tracking, and more, with DCR templates, deployment scripts, and documentation.
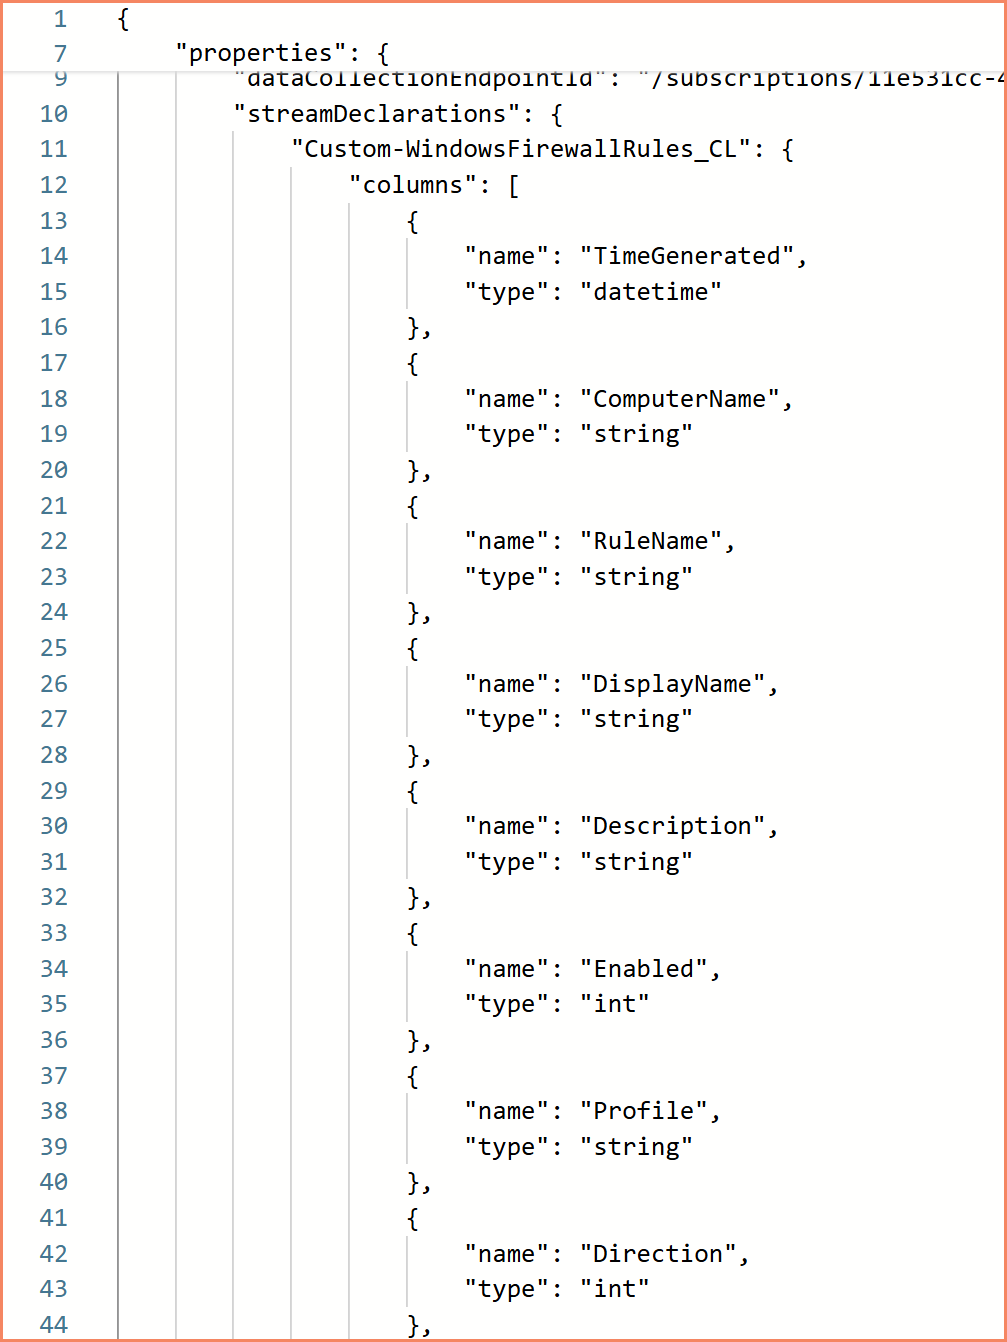
Custom table DCR — stream declarations define the table schema, DCE is linked
IIS Log DCRs
For web server monitoring, IIS log DCRs collect W3C-formatted logs from IIS servers. They look simple but have a critical gotcha:
- DCE is required even without Private Link, unlike Windows Event DCRs
- Uses the standard
Microsoft-W3CIISLogstream - Data volume can be enormous on busy web servers
{
    "properties": {
        "dataCollectionEndpointId": "/subscriptions/YourSubscriptionId/resourceGroups/YourResourceGroupName/providers/Microsoft.Insights/dataCollectionEndpoints/YourDCEName",
        "dataSources": {
            "iisLogs": [
                {
                    "streams": ["Microsoft-W3CIISLog"],
                    "name": "iisLogsDataSource"
                }
            ]
        },
        "destinations": {
            "logAnalytics": [
                {
                    "workspaceResourceId": "/subscriptions/YourSubscriptionId/resourceGroups/YourResourceGroupName/providers/Microsoft.OperationalInsights/workspaces/YourWorkspaceName",
                    "workspaceId": "YourWorkspaceGUID",
                    "name": "YourDestinationName"
                }
            ]
        },
        "dataFlows": [
            {
                "streams": ["Microsoft-W3CIISLog"],
                "destinations": ["YourDestinationName"],
                "transformKql": "source",
                "outputStream": "Microsoft-W3CIISLog"
            }
        ]
    },
    "kind": "Windows"
}
Extension-Based DCRs
Some Azure services create their own DCRs as part of their operation. Defender for SQL is the most common example. It deploys two DCRs: one for threat detection and one for vulnerability assessments.
Key characteristics:
- Service-dependent: the DCR must exist before the service extension works
- Uses the
extensionsdata source type - Multiple specialized streams per service
- Critical: do not delete these. Removing an extension-based DCR breaks the service it supports.
{
    "properties": {
        "description": "Data collection rule for Microsoft Defender for SQL. Deleting this rule will break security monitoring.",
        "dataSources": {
            "extensions": [
                {
                    "streams": [
                        "Microsoft-DefenderForSqlAlerts",
                        "Microsoft-DefenderForSqlLogins",
                        "Microsoft-DefenderForSqlTelemetry",
                        "Microsoft-DefenderForSqlScanEvents",
                        "Microsoft-DefenderForSqlScanResults"
                    ],
                    "extensionName": "MicrosoftDefenderForSQL",
                    "extensionSettings": {
                        "enableCollectionOfSqlQueriesForSecurityResearch": true
                    },
                    "name": "MicrosoftDefenderForSQL"
                }
            ]
        },
        "destinations": {
            "logAnalytics": [
                {
                    "workspaceResourceId": "/subscriptions/YourSubscriptionId/resourceGroups/YourResourceGroupName/providers/Microsoft.OperationalInsights/workspaces/YourWorkspaceName",
                    "workspaceId": "YourWorkspaceGUID",
                    "name": "YourDestinationName"
                }
            ]
        },
        "dataFlows": [
            {
                "streams": [
                    "Microsoft-DefenderForSqlAlerts",
                    "Microsoft-DefenderForSqlLogins",
                    "Microsoft-DefenderForSqlTelemetry",
                    "Microsoft-DefenderForSqlScanEvents",
                    "Microsoft-DefenderForSqlScanResults"
                ],
                "destinations": ["YourDestinationName"]
            }
        ]
    }
}
I've seen environments where someone cleaned up "unused" DCRs and accidentally broke Defender for SQL across an entire subscription. Always check if a DCR is service-managed before deleting it. The description field is your friend here. If it says "do not delete," believe it.
Where Data Collection Rules Actually Come From
There is no single place to create and manage DCRs. Microsoft has spread DCR creation across multiple experiences in the portal, and depending on what you're doing, you end up in completely different blades with different capabilities.
Azure Monitor → Data Collection Rules — the "official" entry point. This is where you go to create DCRs directly: define data sources, destinations, and transformations. It gives you the most control over naming and configuration. But not everything is available here.
Microsoft Sentinel — when you configure data connectors in Sentinel, it creates DCRs behind the scenes. Some of these you can customize, some you can't. The DCR names follow Sentinel's conventions, not yours.
Log Analytics Workspace — this is where it gets confusing. Custom table DCRs? You create those from the workspace blade, not from Azure Monitor. Transformation rules for workspace-level data? Also from the workspace. If you're looking for these options under Azure Monitor → Data Collection Rules, you won't find them. You have to know to go to the workspace directly.
VM Insights — enabling VM Insights on a machine auto-creates a DCR with an MSVMI-* or MSVMOtel-* prefix. You don't choose the name. You don't choose the resource group (in many cases). The portal drives you through a wizard that makes decisions for you.
Defender for Cloud / Defender for SQL — enabling these services creates extension-based DCRs that are essentially hidden from your normal workflow. You didn't ask for them, you didn't name them, and in many cases you only discover they exist when you're auditing your environment or when something breaks.
Azure Monitor Workspace — creating one auto-provisions a managed resource group with a managed DCR and DCE inside it. More on the naming and governance implications of this in the Two Destinations section below.
The result is that DCRs get created from at least six different places in the Azure portal, each with different levels of control over naming, placement, and configuration. Some give you full control. Some give you none. And the documentation for where to find what is scattered across different Microsoft Learn sections. There's no single page that maps out "if you need to do X, go to Y." You just have to know.
This fragmented creation experience is a big part of why DCR governance is so hard in practice. It's not just that people don't follow naming conventions. It's that half the DCRs in your environment were created by services that never gave you the option to name them in the first place.
Performance Monitoring: Three Approaches, Three Destinations
Microsoft now has three completely different ways to collect guest OS performance metrics from virtual machines. Each uses a different DCR data source type, a different stream, sends data to a different destination, uses a different query language, and follows a different pricing model. Choosing the wrong approach, or accidentally running multiple, results in duplicate data and double billing.
Custom Performance DCR (Legacy)
The traditional approach. You create a DCR with specific Windows or Linux performance counters, choose your sampling interval, and the data flows to the Perf table in Log Analytics.
| Property | Value |
|---|---|
| DCR Naming | Your standard convention, e.g. DCR-WINDOWS-PERF-METRICS-WE |
| Data Source Type | performanceCounters |
| Stream | Microsoft-Perf |
| Destination | Log Analytics Workspace → Perf table |
| Query Language | KQL |
| Pricing | Log Analytics per-GB ingestion |
| Status | GA — maintenance mode, no new investment from Microsoft |
{
    "properties": {
        "dataSources": {
            "performanceCounters": [
                {
                    "streams": ["Microsoft-Perf"],
                    "samplingFrequencyInSeconds": 60,
                    "counterSpecifiers": [
                        "\\Processor Information(_Total)\\% Processor Time",
                        "\\Memory\\Available Bytes",
                        "\\LogicalDisk(_Total)\\% Free Space",
                        "\\Network Interface(*)\\Bytes Total/sec"
                    ],
                    "name": "perfCounterDataSource"
                }
            ]
        },
        "destinations": {
            "logAnalytics": [
                {
                    "workspaceResourceId": "/subscriptions/YourSubscriptionId/resourceGroups/YourResourceGroupName/providers/Microsoft.OperationalInsights/workspaces/YourWorkspaceName",
                    "workspaceId": "YourWorkspaceGUID",
                    "name": "YourDestinationName"
                }
            ]
        },
        "dataFlows": [
            {
                "streams": ["Microsoft-Perf"],
                "destinations": ["YourDestinationName"]
            }
        ]
    }
}
This approach supports transformKql, which means you can filter or enrich data before it reaches the workspace, something the other two performance approaches don't offer. The data lands in the Perf table in Log Analytics, which is where many existing KQL workbooks and alert rules already point. The disadvantage is cost: every byte goes through Log Analytics per-GB pricing, and the fact that Microsoft has stopped investing in this path. No new features, no improvements. It works, but it's the legacy approach.
Windows and Linux counters use different naming formats (\Processor Information(_Total)\% Processor Time vs the Linux equivalent), which means you may need separate DCRs per OS. There are no built-in portal dashboards. You build your own workbooks or go without.
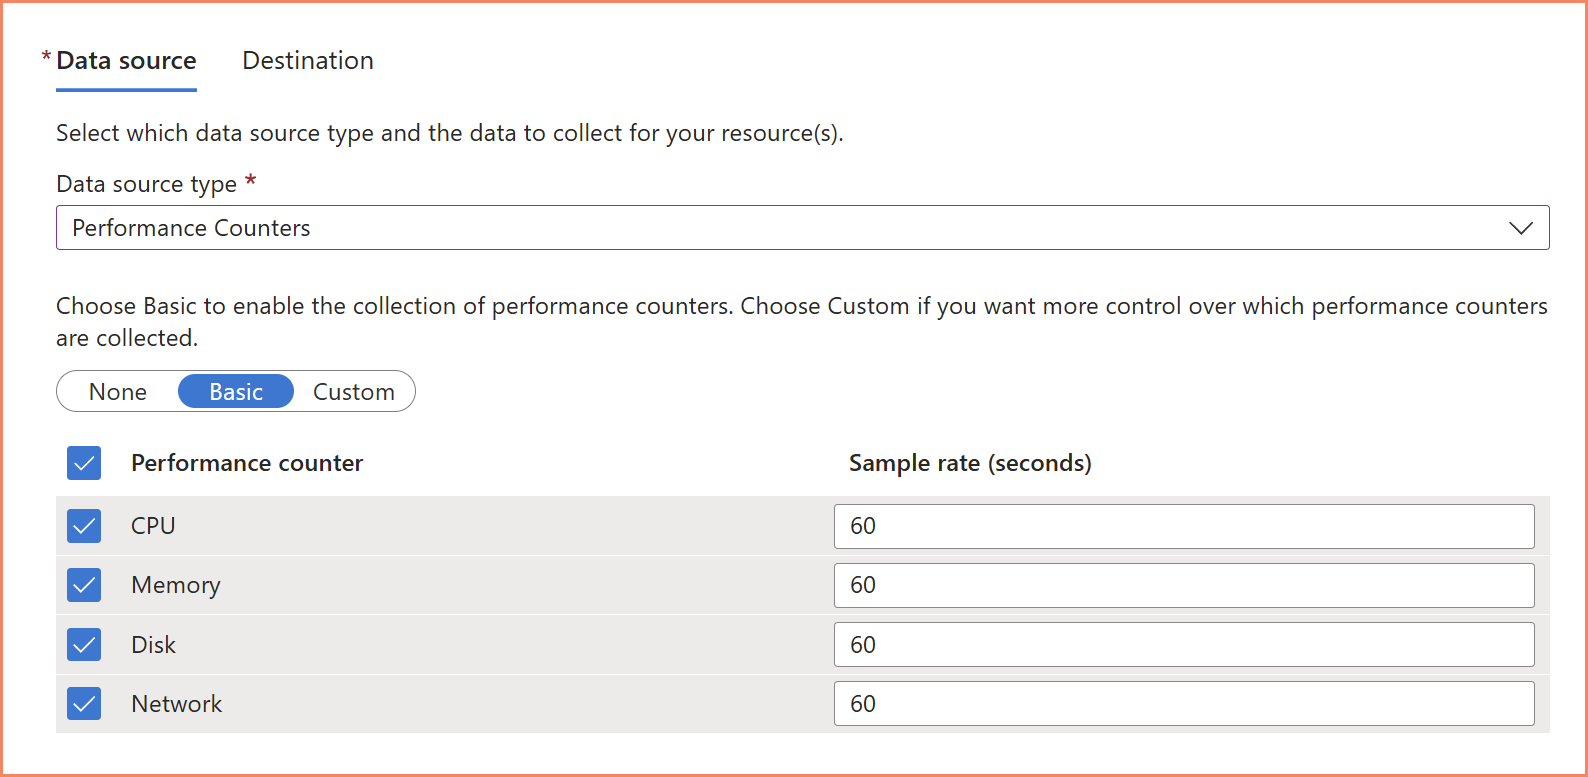
Custom performance DCR — selecting Windows performance counters and sampling interval
VM Insights Classic (Being Superseded)
When you enable VM Insights on a virtual machine, Azure auto-creates a DCR with an MSVMI-* prefix. Instead of listing individual counters, it uses a single special counter specifier, \VmInsights\DetailedMetrics, that automatically collects a predefined, fixed set of performance metrics.
| Property | Value |
|---|---|
| DCR Naming | Auto-generated: MSVMI-<region>-<identifier> |
| Data Source Type | performanceCounters |
| Stream | Microsoft-InsightsMetrics |
| Destination | Log Analytics Workspace → InsightsMetrics table |
| Query Language | KQL |
| Pricing | Log Analytics per-GB ingestion |
| Status | GA — actively being superseded by OpenTelemetry variant |
{
    "properties": {
        "dataSources": {
            "performanceCounters": [
                {
                    "streams": ["Microsoft-InsightsMetrics"],
                    "samplingFrequencyInSeconds": 60,
                    "counterSpecifiers": [
                        "\\VmInsights\\DetailedMetrics"
                    ],
                    "name": "Microsoft-InsightsMetrics"
                }
            ]
        },
        "destinations": {
            "logAnalytics": [
                {
                    "workspaceResourceId": "/subscriptions/YourSubscriptionId/resourceGroups/YourResourceGroupName/providers/Microsoft.OperationalInsights/workspaces/YourWorkspaceName",
                    "workspaceId": "YourWorkspaceGUID",
                    "name": "vmInsightworkspace"
                }
            ]
        },
        "dataFlows": [
            {
                "streams": ["Microsoft-InsightsMetrics"],
                "destinations": ["vmInsightworkspace"]
            }
        ]
    }
}
The \VmInsights\DetailedMetrics specifier is a special aggregate. You cannot add or remove individual counters. It's all or nothing. The data flows to the InsightsMetrics table, which is a completely different table with a different schema than the Perf table used by custom performance DCRs. This means KQL queries written for one table won't work on the other.
The upside is convenience: built-in VM Insights Performance dashboards, normalized counter names across Windows and Linux, and ready-made workbooks in the Azure portal.
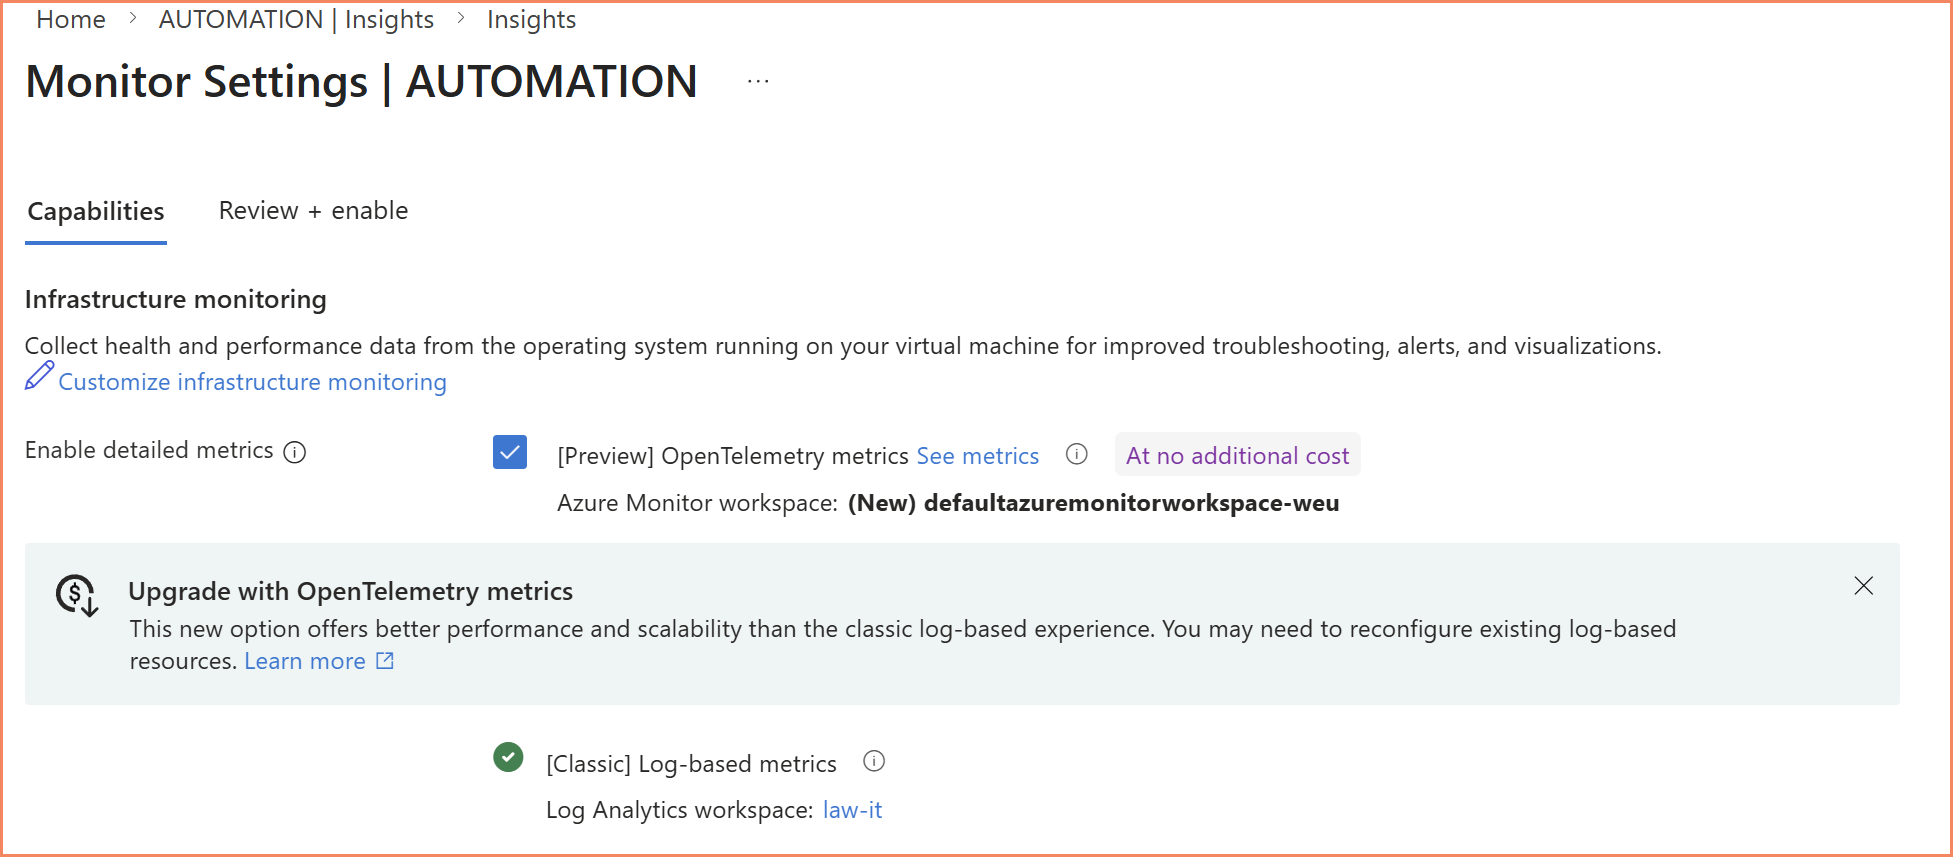
If you've looked at VM Insights recently, you've probably noticed the "Upgrade to new monitoring experience" banner that Azure now prominently displays. Microsoft is actively steering everyone toward the OpenTelemetry variant.
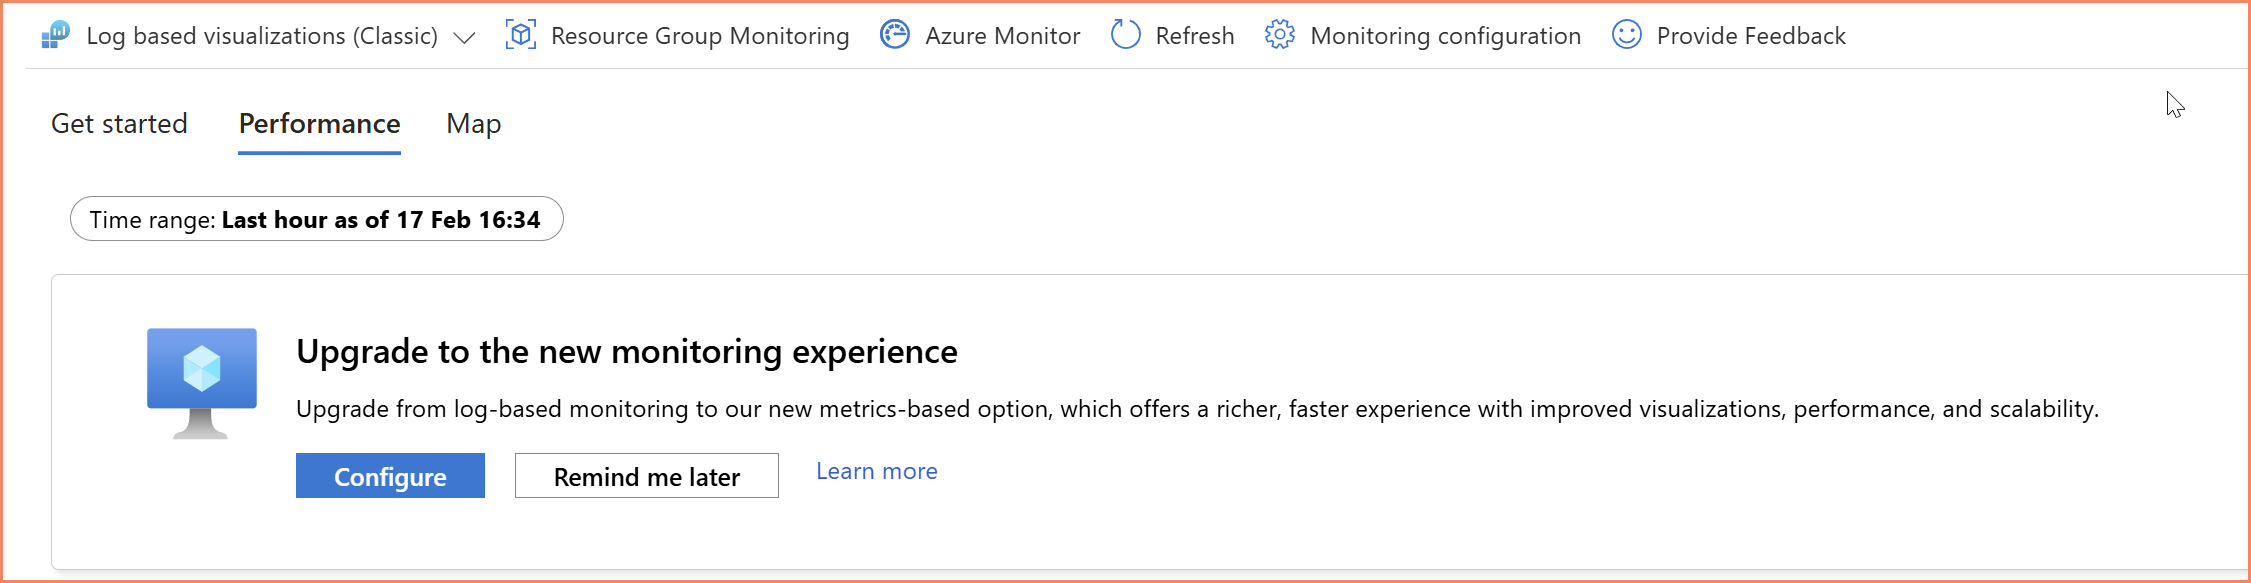
VM Insights classic — notice the "Upgrade to new monitoring experience" banner Microsoft now displays
VM Insights OpenTelemetry (The Future)
This is Microsoft's strategic direction for VM performance monitoring. The OpenTelemetry variant of VM Insights uses a completely different data source type, sends data to a completely different destination, and uses a completely different query language.
| Property | Value |
|---|---|
| DCR Naming | Auto-generated: MSVMOtel-<region>-<identifier> |
| Data Source Type | performanceCountersOTel |
| Stream | Microsoft-OtelPerfMetrics |
| Destination | Azure Monitor Workspace → Metrics store (not Log Analytics!) |
| Query Language | PromQL (industry standard, native Grafana support) |
| Pricing | 10 core metrics free, additional counters at AMW ingestion rate |
| Status | Preview — Microsoft's recommended direction |
{
    "properties": {
        "dataSources": {
            "performanceCountersOTel": [
                {
                    "streams": ["Microsoft-OtelPerfMetrics"],
                    "samplingFrequencyInSeconds": 60,
                    "counterSpecifiers": [
                        "system.cpu.time",
                        "system.memory.usage",
                        "system.disk.io",
                        "system.disk.operations",
                        "system.disk.operation_time",
                        "system.filesystem.usage",
                        "system.network.io",
                        "system.network.dropped",
                        "system.network.errors",
                        "system.uptime"
                    ],
                    "name": "otelPerfCounterDataSource"
                }
            ]
        },
        "destinations": {
            "monitoringAccounts": [
                {
                    "accountResourceId": "/subscriptions/YourSubscriptionId/resourceGroups/YourResourceGroupName/providers/Microsoft.Monitor/accounts/YourAzureMonitorWorkspaceName",
                    "name": "YourAMWDestinationName"
                }
            ]
        },
        "dataFlows": [
            {
                "streams": ["Microsoft-OtelPerfMetrics"],
                "destinations": ["YourAMWDestinationName"]
            }
        ]
    },
    "kind": "Windows"
}
Look at how different this is from the other two approaches. The data source type is performanceCountersOTel, not performanceCounters. The destination type is monitoringAccounts with an accountResourceId, not logAnalytics with a workspaceResourceId. The counter names use OpenTelemetry standard naming like system.cpu.time instead of \Processor Information(_Total)\% Processor Time, unified across Windows and Linux.
The ten default counters listed above are collected at no ingestion cost. Free. With 18 months of retention. Compare that to the per-GB pricing of the other two approaches, and the cost conversation changes dramatically.
Beyond the defaults, you can add additional counters like system.cpu.utilization, process.cpu.utilization, and process.memory.usage at Azure Monitor Workspace ingestion rates. The per-process metrics (CPU, memory, and disk I/O at the individual process level) are something the other two approaches simply cannot do.
VM Insights OpenTelemetry — new configuration flow with Azure Monitor Workspace selection
Comparison at a Glance
| Criteria | Custom Perf DCR | VM Insights Classic | VM Insights OTel |
|---|---|---|---|
| Status | GA — Legacy | GA — Superseded | Preview — Recommended |
| Data Source | performanceCounters |
performanceCounters |
performanceCountersOTel |
| Stream | Microsoft-Perf |
Microsoft-InsightsMetrics |
Microsoft-OtelPerfMetrics |
| Destination | Log Analytics → Perf table | Log Analytics → InsightsMetrics table | Azure Monitor Workspace → Metrics store |
| Query Language | KQL | KQL | PromQL |
| Pricing | ~per-GB ingestion | ~per-GB ingestion | Core metrics free, extras at AMW rate |
| Counter Control | Full — pick any counter | None — fixed set | Extensible — default + custom |
| Per-Process Metrics | Limited | No | Yes |
| Required Agents | AMA | AMA | AMA |
| Portal Dashboards | None | VM Insights Performance | New VM Insights Performance (preview) |
| Data Retention | 31 days free, up to 12 years | 31 days free, up to 12 years | 18 months at no additional cost |
| Grafana Integration | Via Log Analytics data source | Via Log Analytics data source | Native — AMW is Prometheus-compatible |
| Microsoft Investment | Maintenance mode | Maintenance mode | Active development |
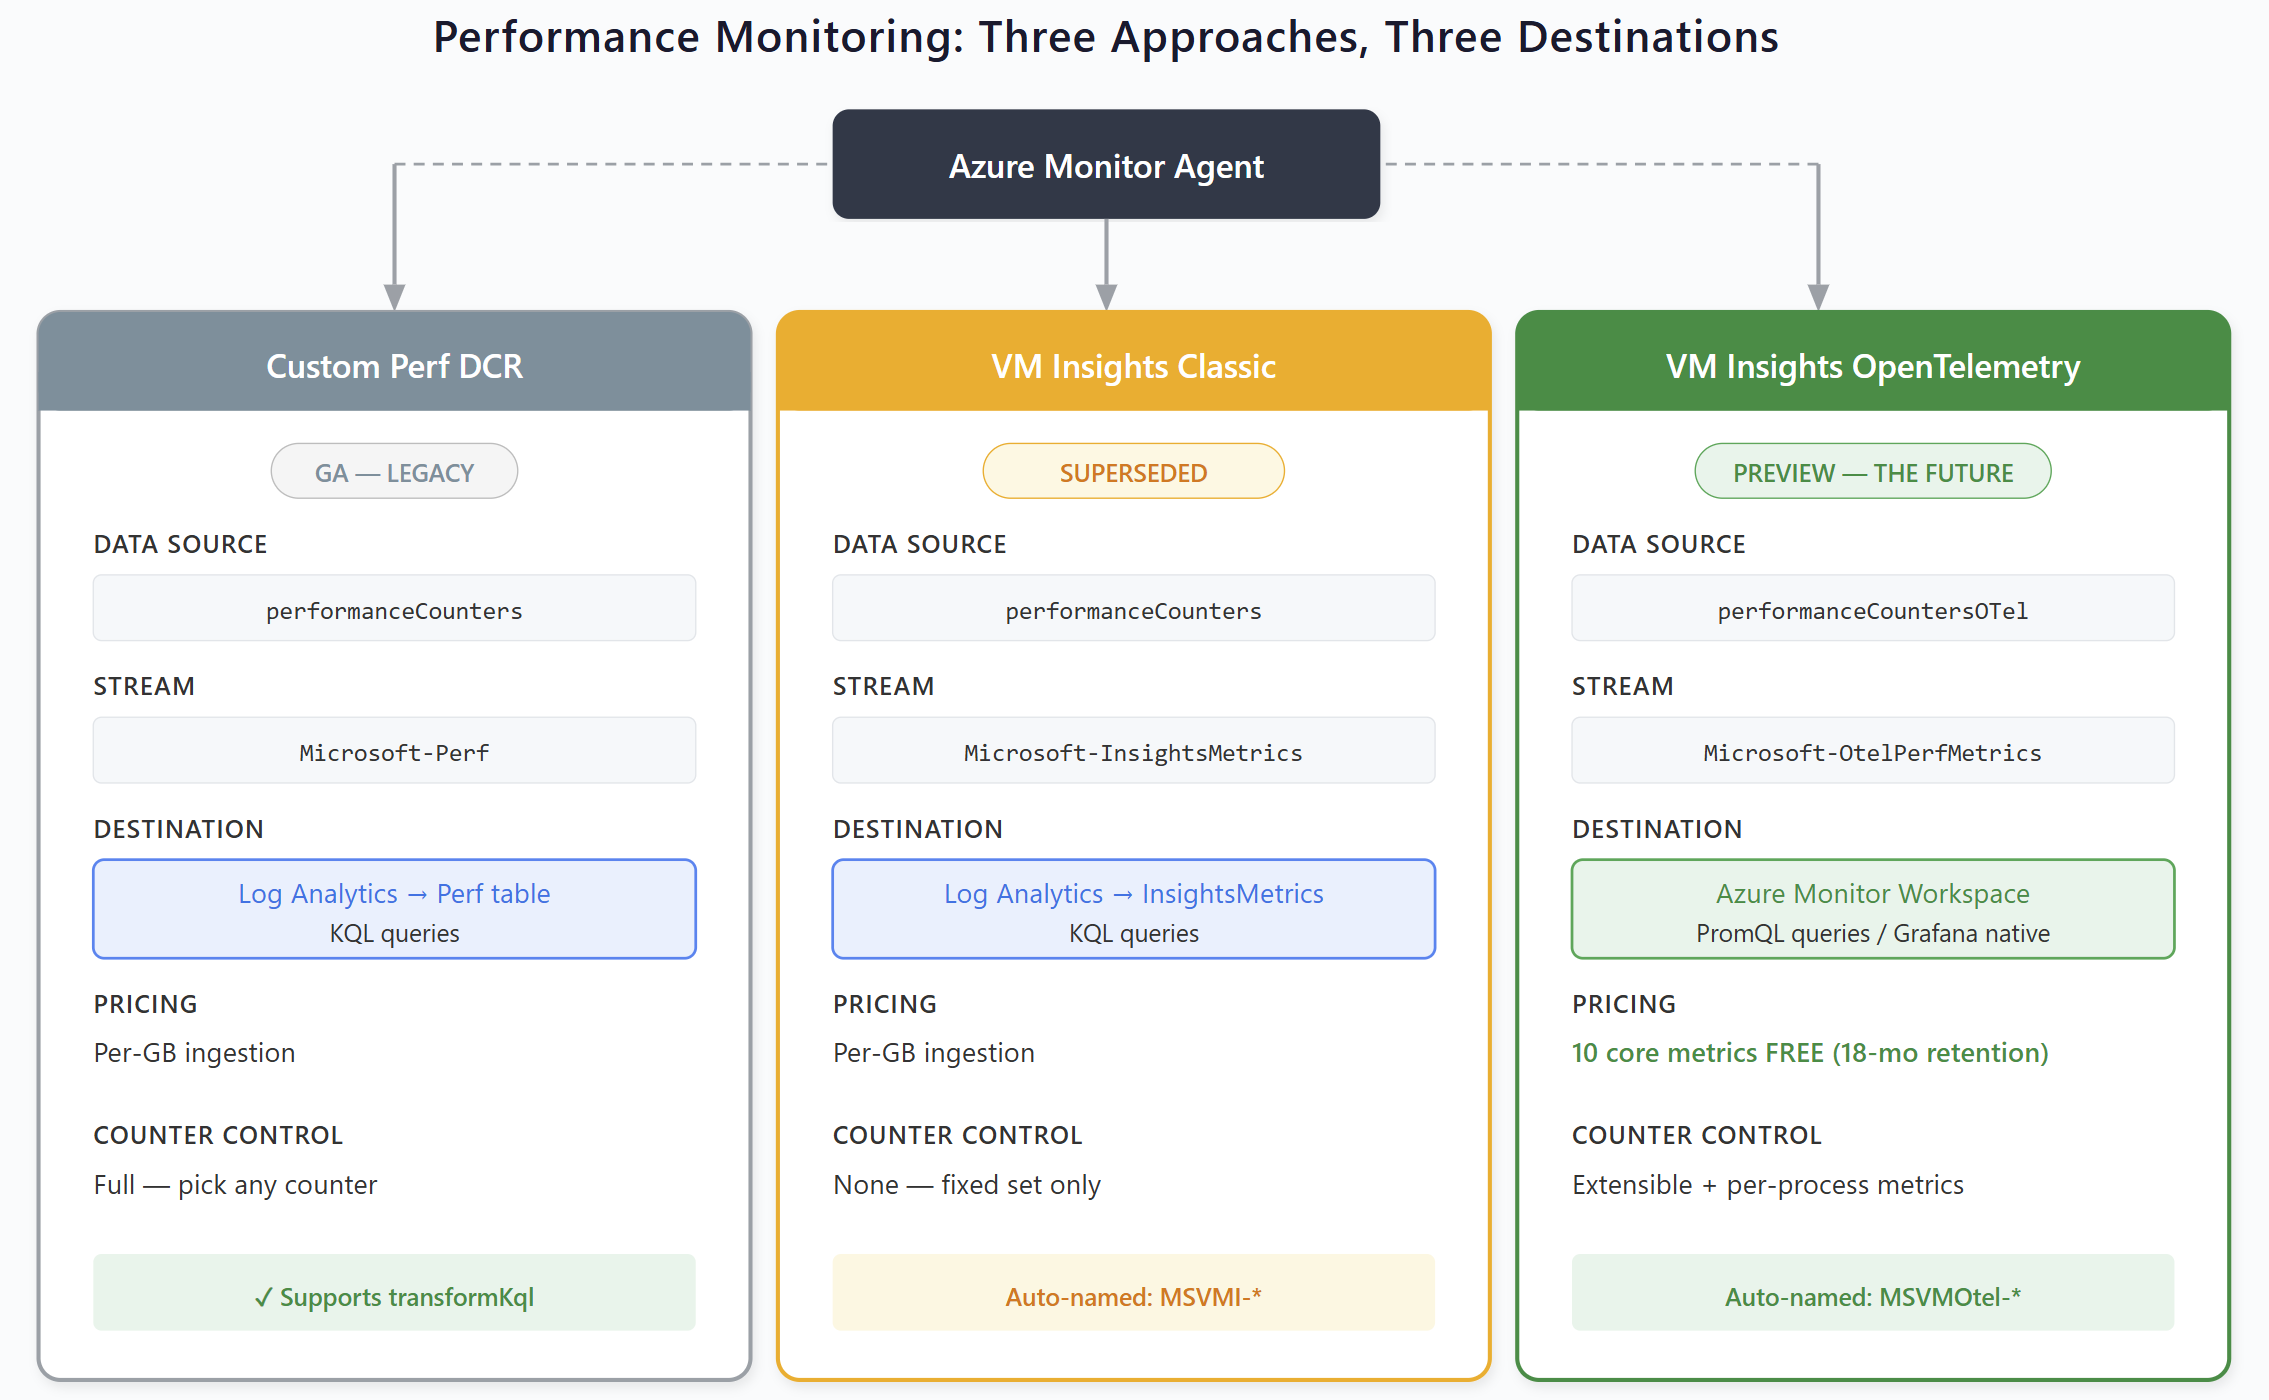
Three performance monitoring approaches, three different destinations
Don't Mix Approaches on the Same Machine
If you're migrating, it's fine to run them in parallel temporarily to validate that OTel data is flowing correctly. But once you've confirmed the data, remove the legacy DCR. Don't leave both running indefinitely.
The Architectural Shift: Two Destinations
This is the part that has the biggest impact on how you design monitoring going forward. For years, everything went to Log Analytics Workspace. Events, logs, performance counters, custom data: all to one destination, all queried with KQL.
That's no longer the case.
Log Analytics Workspace remains the destination for:
- Windows Events and security logs
- IIS logs
- Custom table data (API-based collection)
- Sentinel workloads
- Anything that needs KQL-based analytics
Azure Monitor Workspace is becoming the destination for:
- Performance metrics (via OTel)
- Container metrics (Container Insights)
- Application metrics (Application Insights)
- Anything that benefits from PromQL and Grafana-native integration
This isn't a future hypothetical. It's happening now. When you enable VM Insights with the OpenTelemetry option, the DCR targets an Azure Monitor Workspace. When you look at Container Insights and Application Insights, they're on the same trajectory. Microsoft is converging all three products on Azure Monitor Workspace + PromQL as the standard metrics platform.
What This Means Practically
For new project designs, you need to plan for two destinations from day one:
- Azure Monitor Workspace provisioning — where to create it, naming, resource group placement. And here's the frustrating part: when you create an AMW, Microsoft automatically creates three resources in a managed resource group that you cannot rename, cannot move, and cannot prevent. A managed resource group (
MA_<amw-name>_<location>_managed), a managed DCE, and a managed DCR, all with auto-generated names that ignore your enterprise naming conventions. If you have Azure Policy enforcing naming standards or tag requirements, these auto-created resources will trigger violations. Microsoft's official recommendation? Create Azure Policy exemptions for them. - Query language strategy — teams that have invested heavily in KQL workbooks and alert rules for performance data will need to plan for PromQL adoption. These are fundamentally different languages.
- Visualization tooling — Azure Monitor Workspace integrates natively with Grafana rather than Log Analytics Workbooks. This may require changes to how dashboards are built and maintained.
- Cost modeling — the pricing model is fundamentally different. Core OTel metrics are free with 18 months retention, while Log Analytics charges per-GB ingestion.
- DCR design — performance counter DCRs now target
monitoringAccountsinstead oflogAnalytics, use different streams, and follow different naming conventions.
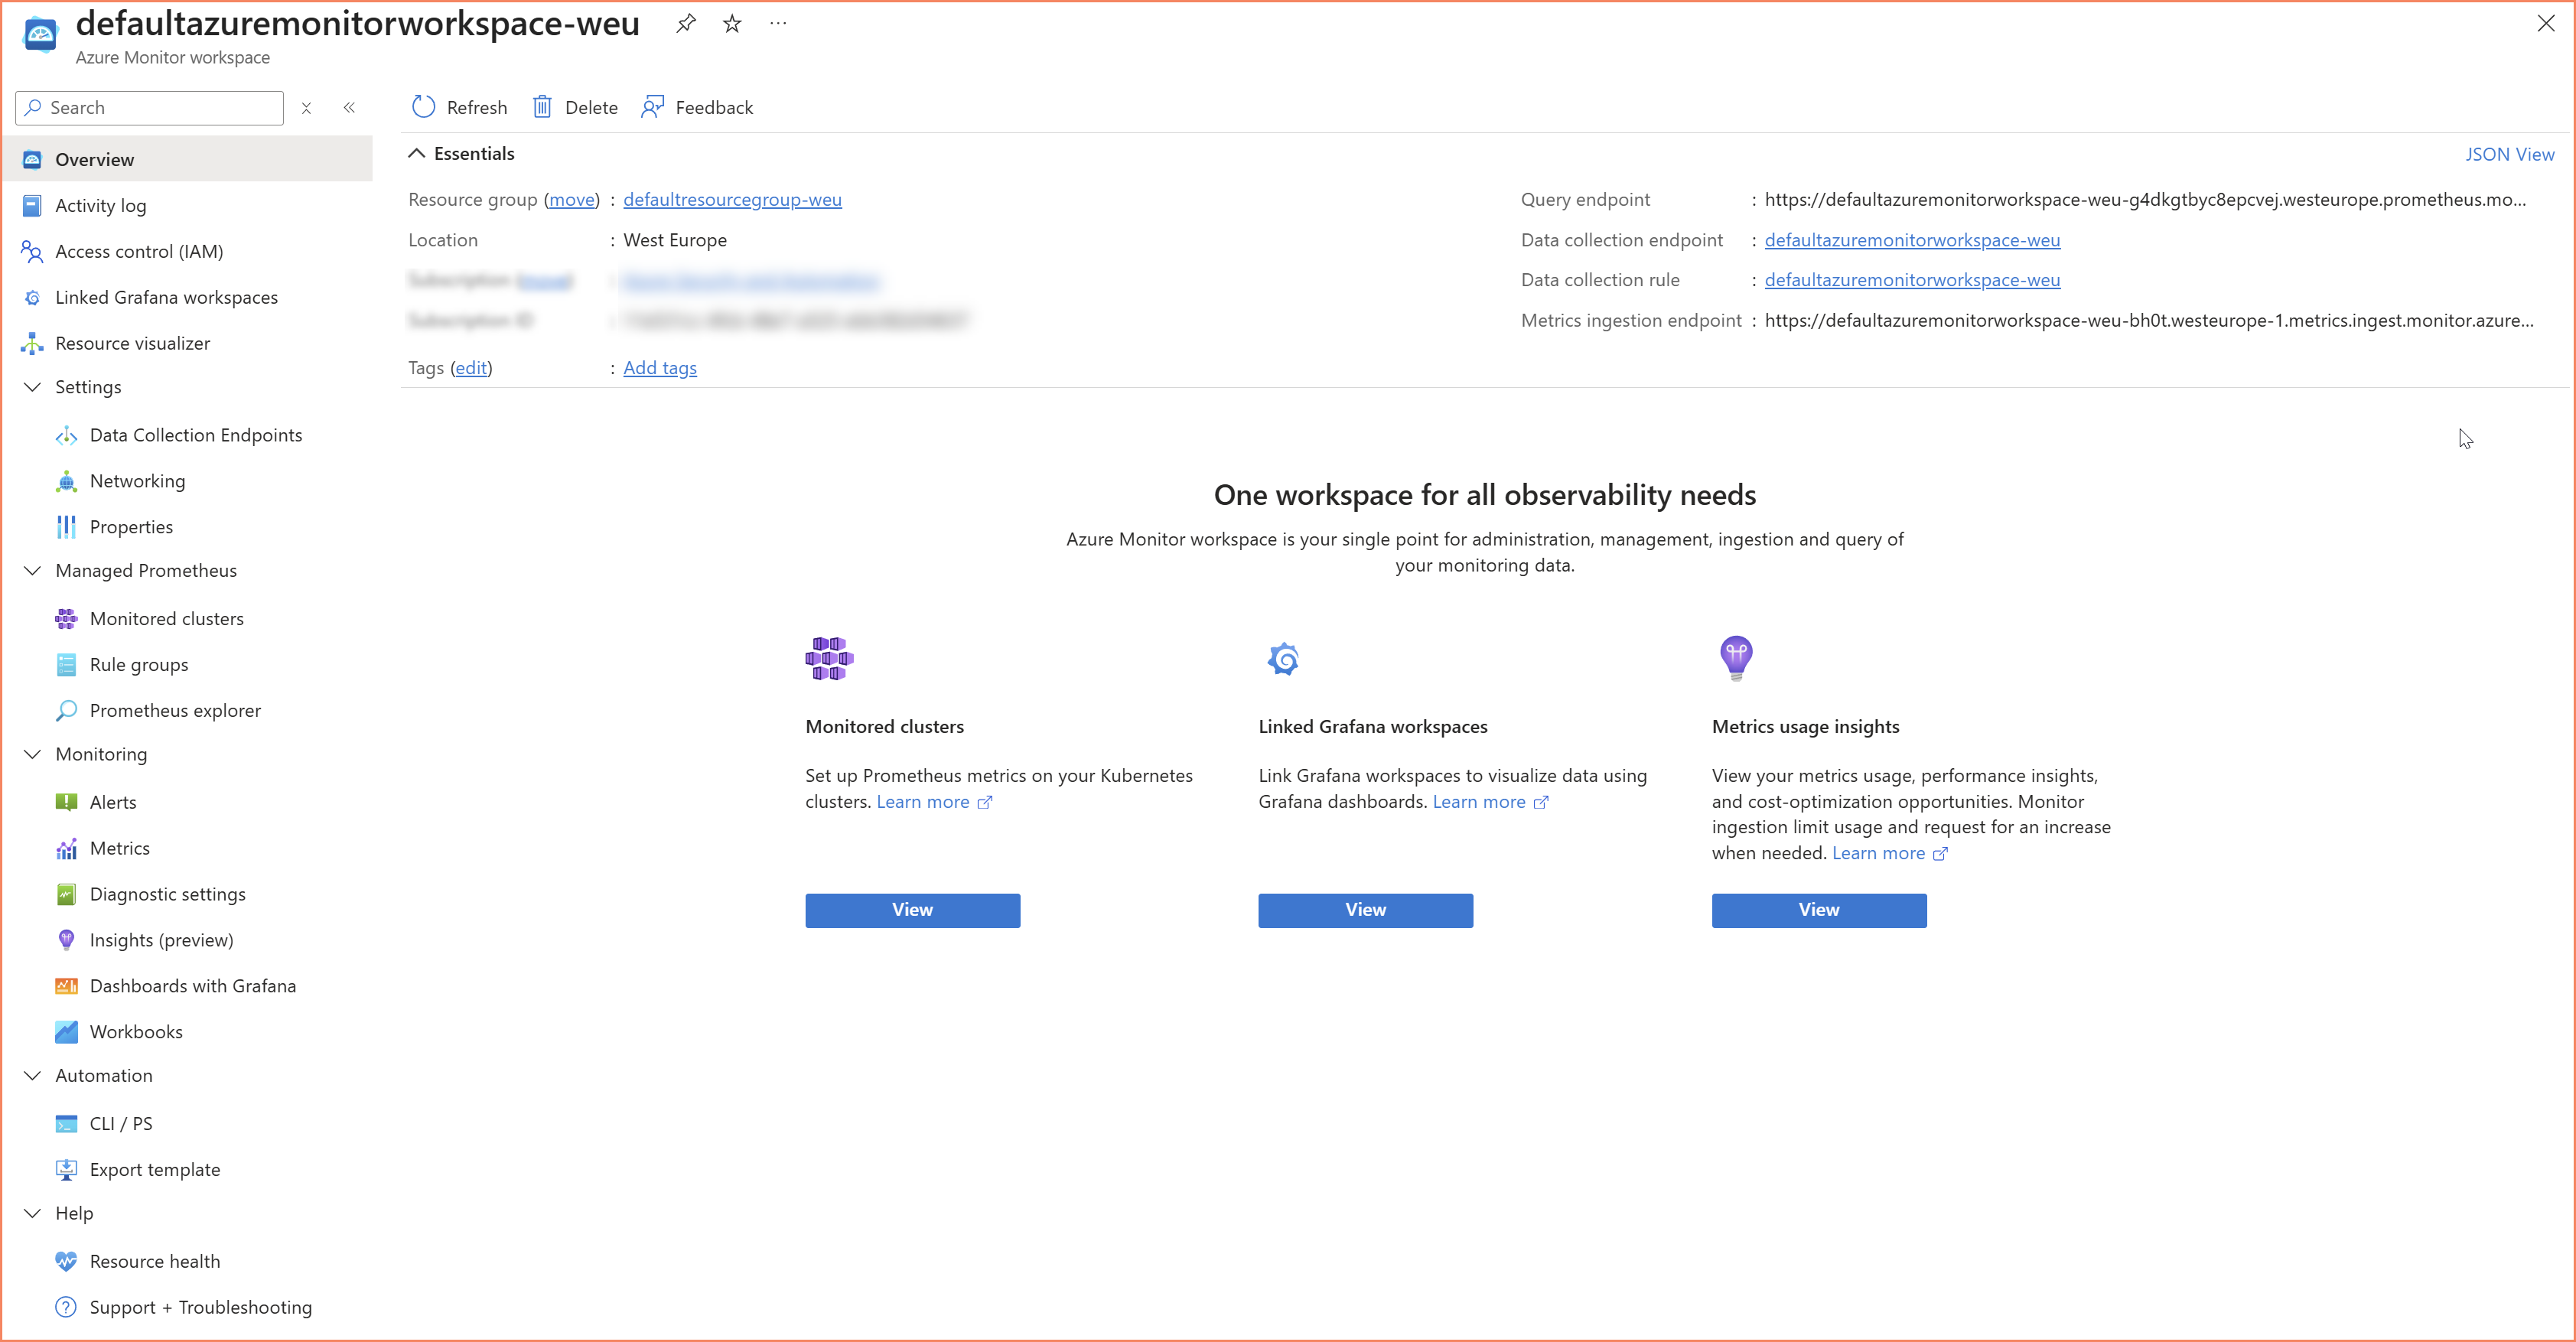
Azure Monitor Workspace overview — note the auto-created managed resources
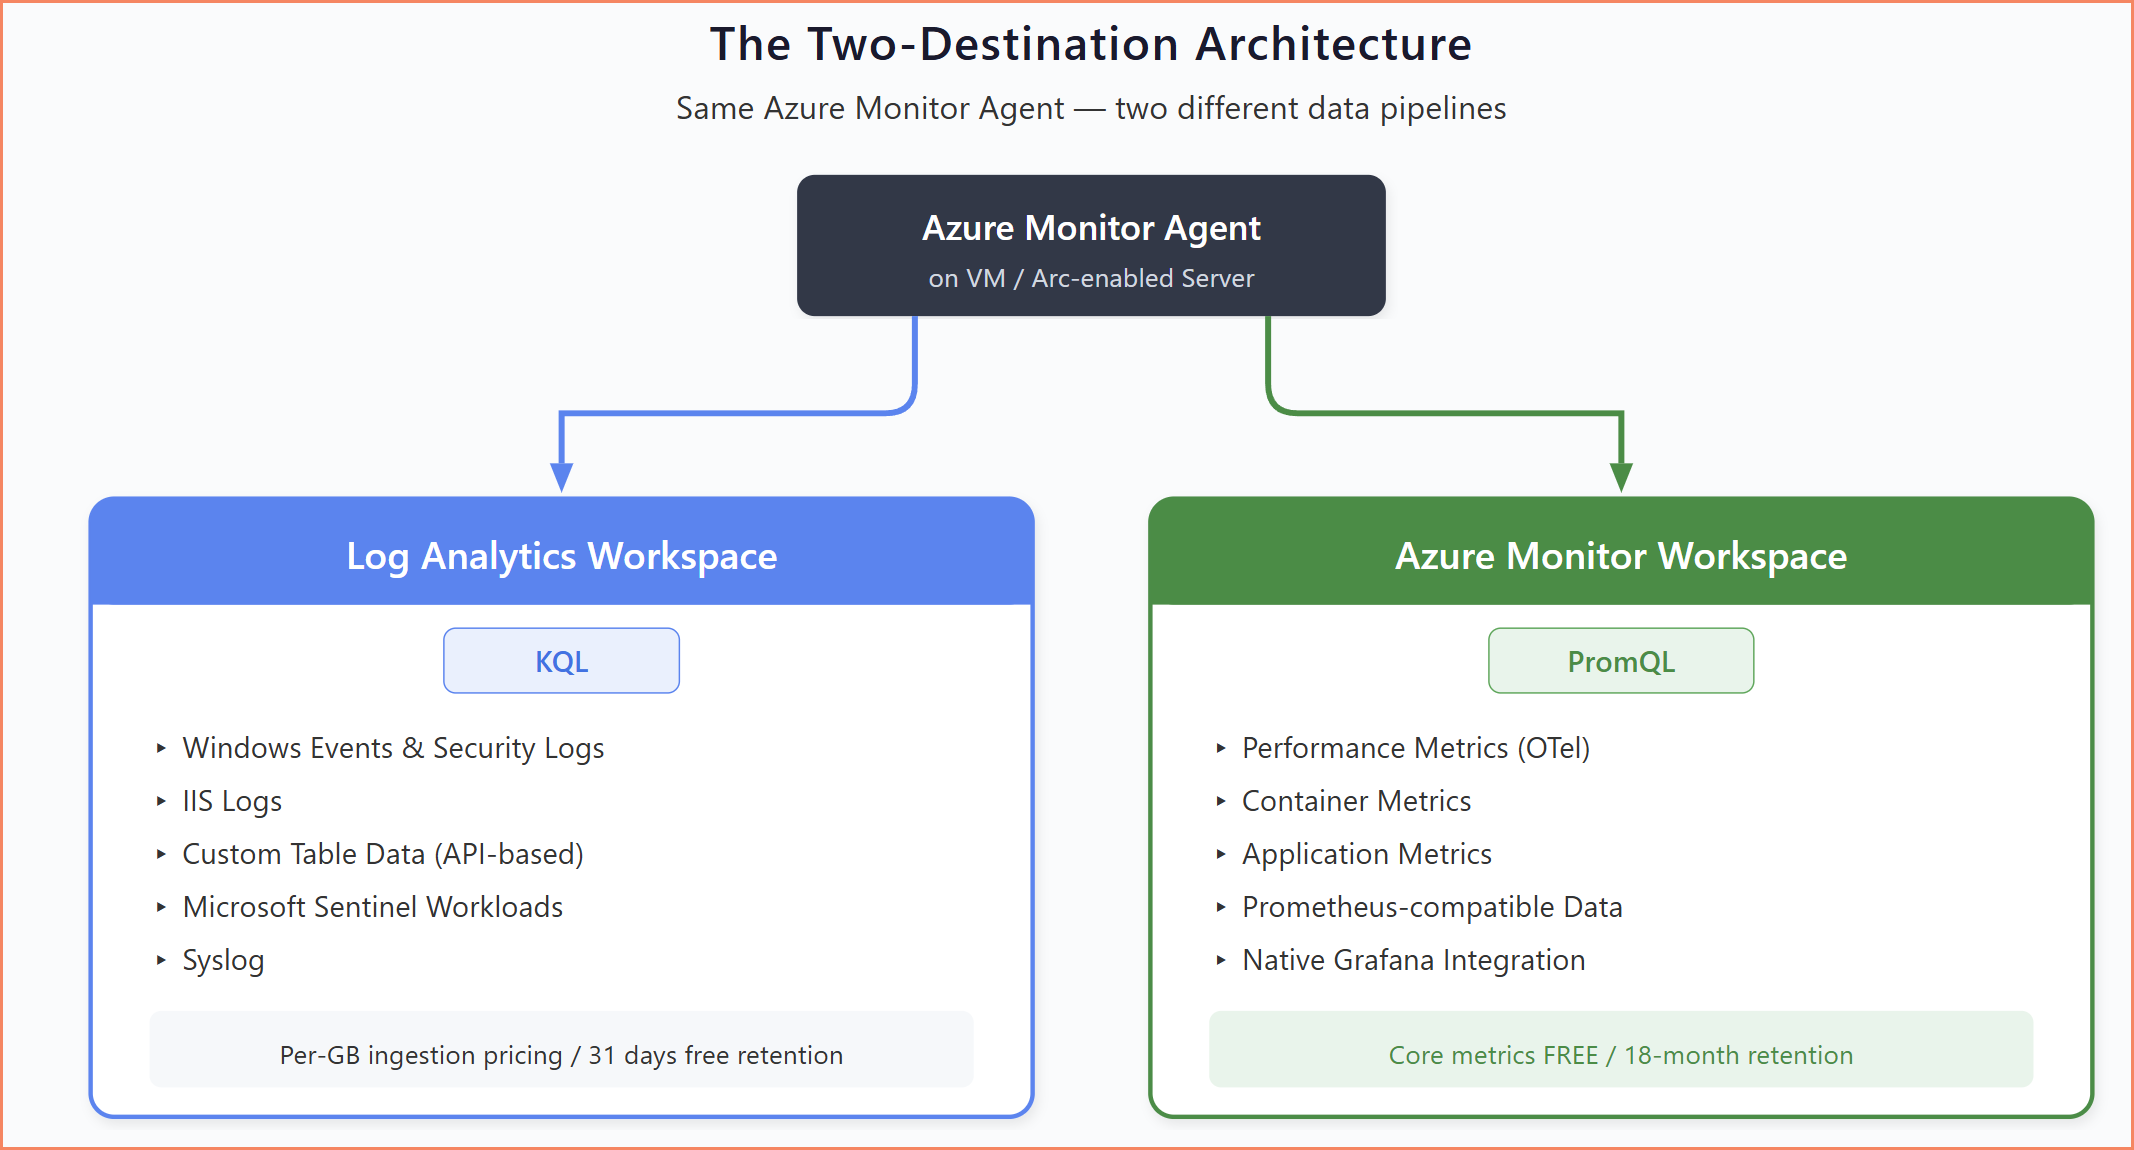
Two-destination architecture — which data goes where from the same Azure Monitor Agent
Managing DCRs at Scale
In most enterprise environments I've worked with, DCR governance is either an afterthought or completely absent. As covered in the previous sections, DCRs get created from many different places, most of them outside your control. Unlike virtual machines where you can clearly see what's running and what it costs, DCRs are invisible infrastructure. They sit quietly in resource groups, collecting and routing data, generating ingestion costs, with no built-in way to see the full picture across your environment.
Before You Start: Think It Through and Set Up Guardrails
When you're starting to roll out monitoring, take the time to think through naming, structure, and governance before deploying anything. I know the pressure is always to "just get it working," but the cost of cleaning up later is significantly higher than spending a few hours on conventions upfront.
Naming Conventions
I still believe in naming conventions. The pattern I use across implementations:
DCR-SOURCE-DATATYPE-REGION
Where:
- SOURCE: How data is collected (API, AGENT, WINDOWS, etc.)
- DATATYPE: What data is being collected (SECURITY-EVENTS, PERF-METRICS, AD-DELEGATIONS, etc.)
- REGION: Geographic indicator (WE, EUS, etc.)
Real examples:
DCR-API-AD-DELEGATIONS-WE— API-based AD delegation data collection in West EuropeDCR-WINDOWS-SECURITY-EVENTS-WE— Agent-based security event collectionDCR-WINDOWS-PERF-METRICS-WE— Agent-based custom performance counters
This naming immediately tells you: is it API-based or agent-based? What data does it collect? Where is it deployed?
The auto-generated DCRs from VM Insights follow their own conventions (MSVMI-* for classic, MSVMOtel-* for OTel), and you can't change those names. But for every DCR you create yourself, apply a naming convention.
Tagging Strategy
Beyond naming, Azure resource tags provide the filtering and organizational capabilities you need at scale:
{
    "Environment": "Production",
    "DataSource": "API",
    "Owner": "SecurityTeam",
    "CostCenter": "IT-SEC-12345",
    "Purpose": "ComplianceMonitoring"
}
Tags matter for cost allocation, automation, governance, and lifecycle management — our tag compliance monitoring solution tracks whether those tags are actually applied. They let you answer questions like "which DCRs belong to the security team?" or "what test DCRs should be cleaned up?" without inspecting each rule individually.
Preventing Duplicate Collection
One of the most expensive mistakes I see is unintentional data duplication. Multiple DCRs targeting the same data sources on the same machines result in duplicate data in your workspace: double the ingestion cost, skewed dashboards, and false-positive alerts.
This happens most often when:
- Multiple teams independently deploy DCRs to shared infrastructure
- Overlapping Windows Event collection configurations (Security, Common, All)
- Migrating from pilot to production without removing test DCRs
- Portal-deployed DCRs create per-machine rules instead of shared ones
There's no built-in "show me every DCR associated with this machine across all subscriptions" view in Azure. You can query Azure Resource Graph for DCR associations (see our KQL query reference for more Resource Graph examples), but only for resources within your access scope. If another team's DCR lives in a subscription you can't read, it's invisible to you.
The portal makes this worse. When you enable monitoring through the Azure portal on individual VMs, it often creates a DCR-per-machine instead of using a shared DCR. Do that across 200 servers and you have 200 nearly-identical DCRs instead of one shared rule. Always prefer programmatic DCR deployment with shared rules over portal-based per-machine creation — our automation consulting handles this at scale.
The Description Field
The description field on a DCR is worth calling out. The Azure portal doesn't expose it during creation, so it's easy to miss. But you can set it via PowerShell, ARM templates, or the REST API.
Use it. When someone needs to understand what a DCR does, whether it can be modified, and who owns it, the description is where that context should live.
"description": "Collects AD modification events (5136) for SOC monitoring. Created by Security Team (March 2025). Required for compliance reporting - DO NOT DELETE without consulting Security."
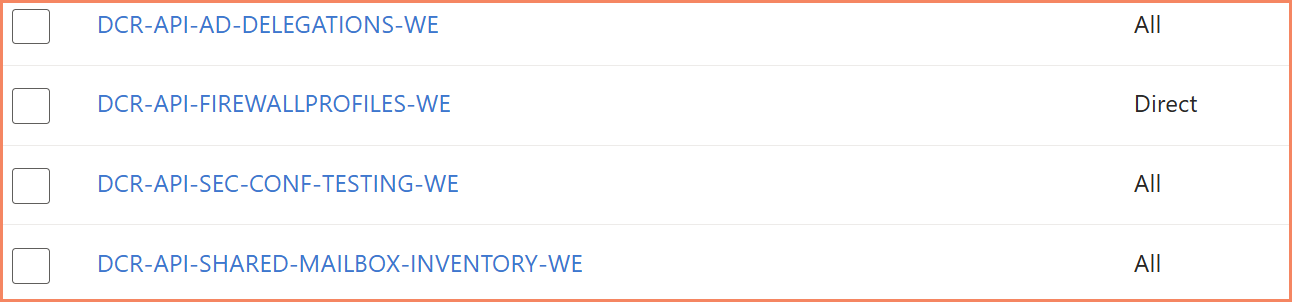
Well-named DCRs following the DCR-SOURCE-DATATYPE-REGION convention with tags
What This Means for Your Monitoring Architecture
Over the years, I've been running Azure Arc for Servers training, and one thing I see consistently: after the training, students realize just how big the architecture is when you're building a hybrid cloud foundation with Azure Arc and layering monitoring services on top of it. Network zones, extensions, Azure Policies, managed identities, Data Collection Rules, Data Collection Endpoints, Log Analytics Workspaces, and now Azure Monitor Workspaces. There's a lot that needs to be designed properly before you deploy anything.
And it keeps getting more complex. Companies and teams want more options to configure, more granularity, more control, which is fair. But every new option means more complexity for us to manage. More DCR types, more destination types, more agents and extensions to keep track of. There is nothing easy about this, and pretending otherwise doesn't help anyone planning a real implementation.
New Projects: Design for Two Destinations
For any new monitoring engagement starting in 2026, the two-destination architecture needs to be part of the design from day one — our Arc enablement service includes monitoring architecture as part of the engagement. That means Azure Monitor Workspace provisioning, PromQL training for operations teams, Grafana deployment for metrics visualization, and DCR design that targets the correct destination type for each data category.
Existing Projects: Start with the Question Nobody Asks
If you haven't done an assessment from the top-level management group of how many Data Collection Rules, Data Collection Endpoints, and Log Analytics Workspaces you have today, you're missing out. And the same goes for Azure Monitor Workspaces now. These resources cost money every day, and in many environments nobody has a clear picture of the total.
For environments that were designed before the OTel shift, you likely have:
- Custom Performance DCRs sending to the Perf table at per-GB cost
- VM Insights Classic DCRs sending to InsightsMetrics at per-GB cost
- KQL-based workbooks and alert rules built on these tables
- Portal-deployed DCRs with per-machine naming that have grown organically
These environments continue to work. Microsoft is not removing Log Analytics support for performance data. But they're not investing in it either, and the cost difference alone makes it worth revisiting — our workspace cost report helps you see where the money is going.
A Phased Approach
- Audit — identify all performance-related DCRs, which tables they target, and what workbooks or alerts depend on them
- Pilot — enable the OTel variant alongside existing collection on a subset of machines to validate data quality and build PromQL familiarity
- Plan — map out which KQL queries need PromQL equivalents, which dashboards need to move from Workbooks to Grafana
- Migrate — move machine groups progressively, removing legacy DCRs only after confirming OTel data flow and dependent alerting works
Don't Rush
The OTel variant is still in Preview. The classic approach still works and is fully supported. There's no urgency to migrate production environments overnight. The goal is to start designing new projects for the new architecture and to have a plan for existing ones, not to panic-migrate everything.
The cost savings are real (free core metrics vs per-GB ingestion), but so are the risks of adopting Preview features in production. Run parallel, validate, and migrate incrementally.
Closing
For me, this all comes down to what I call the data collection framework, my own definition for the full picture of implementing monitoring on Azure. It's not just about individual Data Collection Rules. It's the combination of DCRs, Data Collection Endpoints, the associations that link rules to machines, and the governance layer that controls all of it: who creates what, what naming conventions are followed, what tags are applied, and how costs are tracked.
Be smart about it. Control who has the ability to create Data Collection Rules and workspaces. Make sure governance is in place before you open up access. If you allow people to randomly create monitoring resources in Azure without oversight, it will be a disaster, and I've seen that happen more than once.
On the deployment side, Azure Policy is the main vehicle for DCR associations at scale. But deploying policies isn't the end of the story. You still need to monitor those policies, track which machines have associations and which don't, and follow up on compliance gaps. A policy that shows 95% compliant is also telling you that 5% of your machines aren't collecting the data you think they are.
This guide didn't cover every aspect of a production monitoring environment. There's more to say about identity, permissions, data ingestion patterns, and transformation strategies — our security consulting covers the full architecture. But I hope you found something useful here, whether you're planning a new monitoring architecture or trying to get an existing one back under control.
Good luck with it.
About the Author

🎯 Specializations
- Microsoft Defender XDR
- Microsoft Sentinel SIEM & SOAR
- Microsoft Entra ID (Azure AD)
- Microsoft Intune
- Azure Arc Services
- Azure Log Analytics
- Azure Automation
- Hybrid Cloud Management