Extract user activity from Microsoft Graph API and organize it by device, location, application, and time patterns. Ready-to-use views instead of raw log entries.
The portal shows events. You need patterns, timelines, and summaries.
Portal shows individual events. You scroll, filter, export. The data exists but isn't organized.
Export to spreadsheet. Build charts yourself. Hours of work for each question.
Large date ranges fail to load. Partial exports. You work around the tool instead of with it.
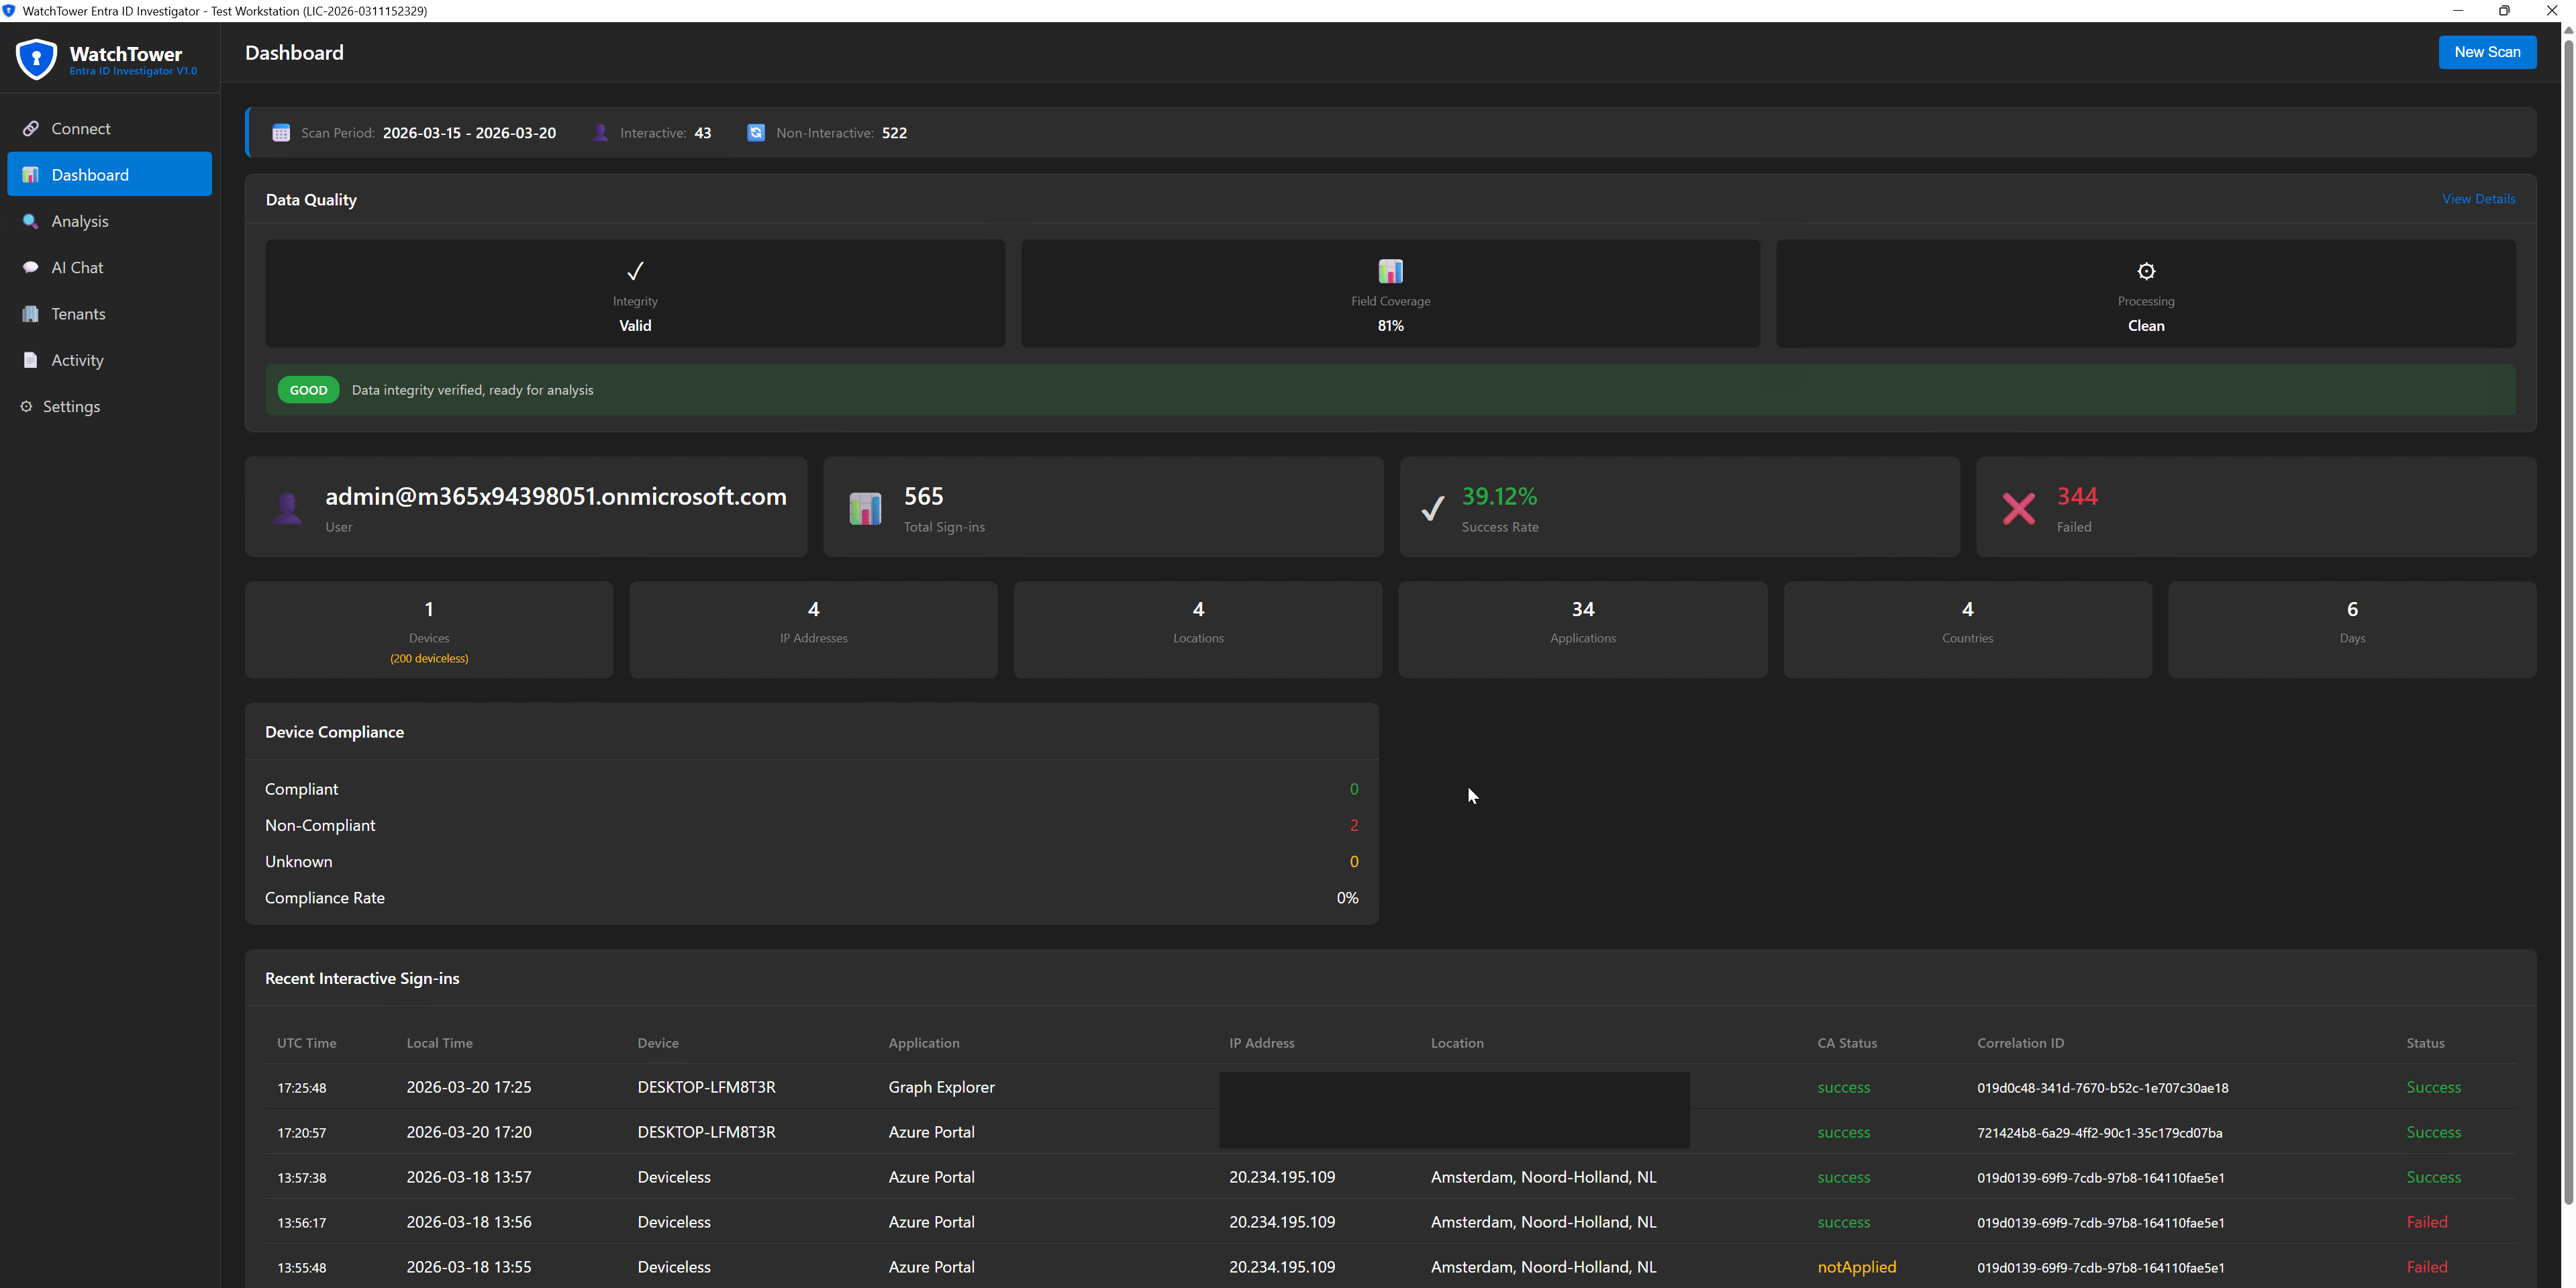
WatchTower extracts sign-in data from Graph API and organizes it into structured views - by device, location, application, and time.
Same data. Structured so you can see what happened.
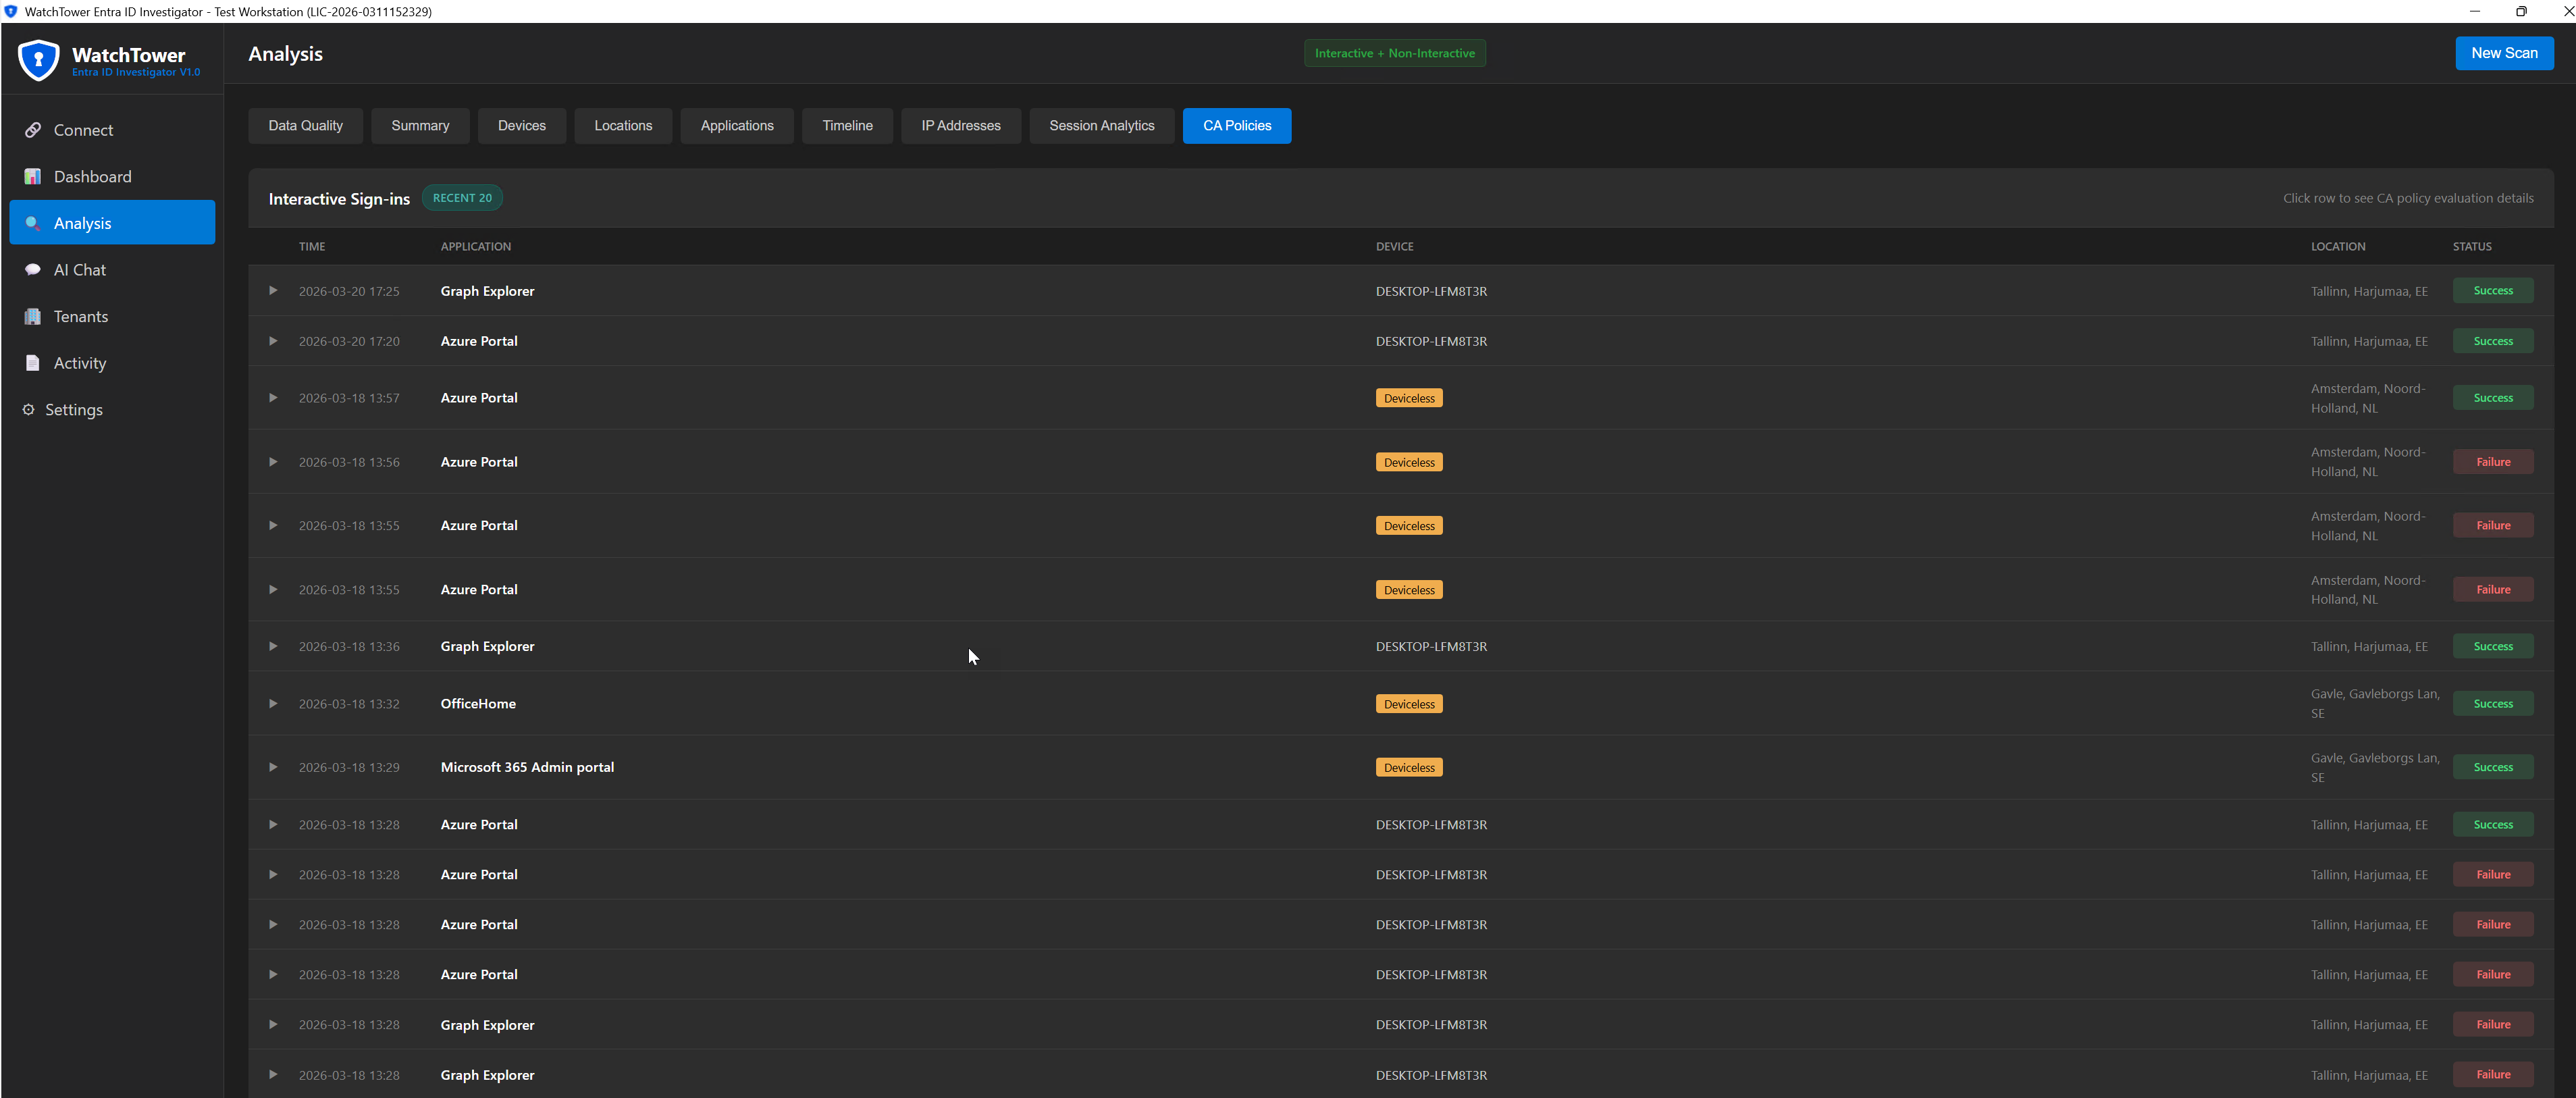
Instead of scrolling through hundreds of individual sign-in events trying to piece together the story, you get organized views that show you locations at a glance, devices at a glance, applications at a glance. The analysis structure is already built - you just interpret the results.
The extraction time depends on scan type and event count. No portal timeouts, no partial exports, no manual correlation work. You define the date range and WatchTower handles the rest.
Whether you need the last week or your full retention period, WatchTower extracts the dataset directly from Graph API without portal limitations.
Everything exports to CSV with the analysis already structured. If you need to share findings with colleagues, leadership, or compliance teams, the data is organized and presentable without additional formatting work.
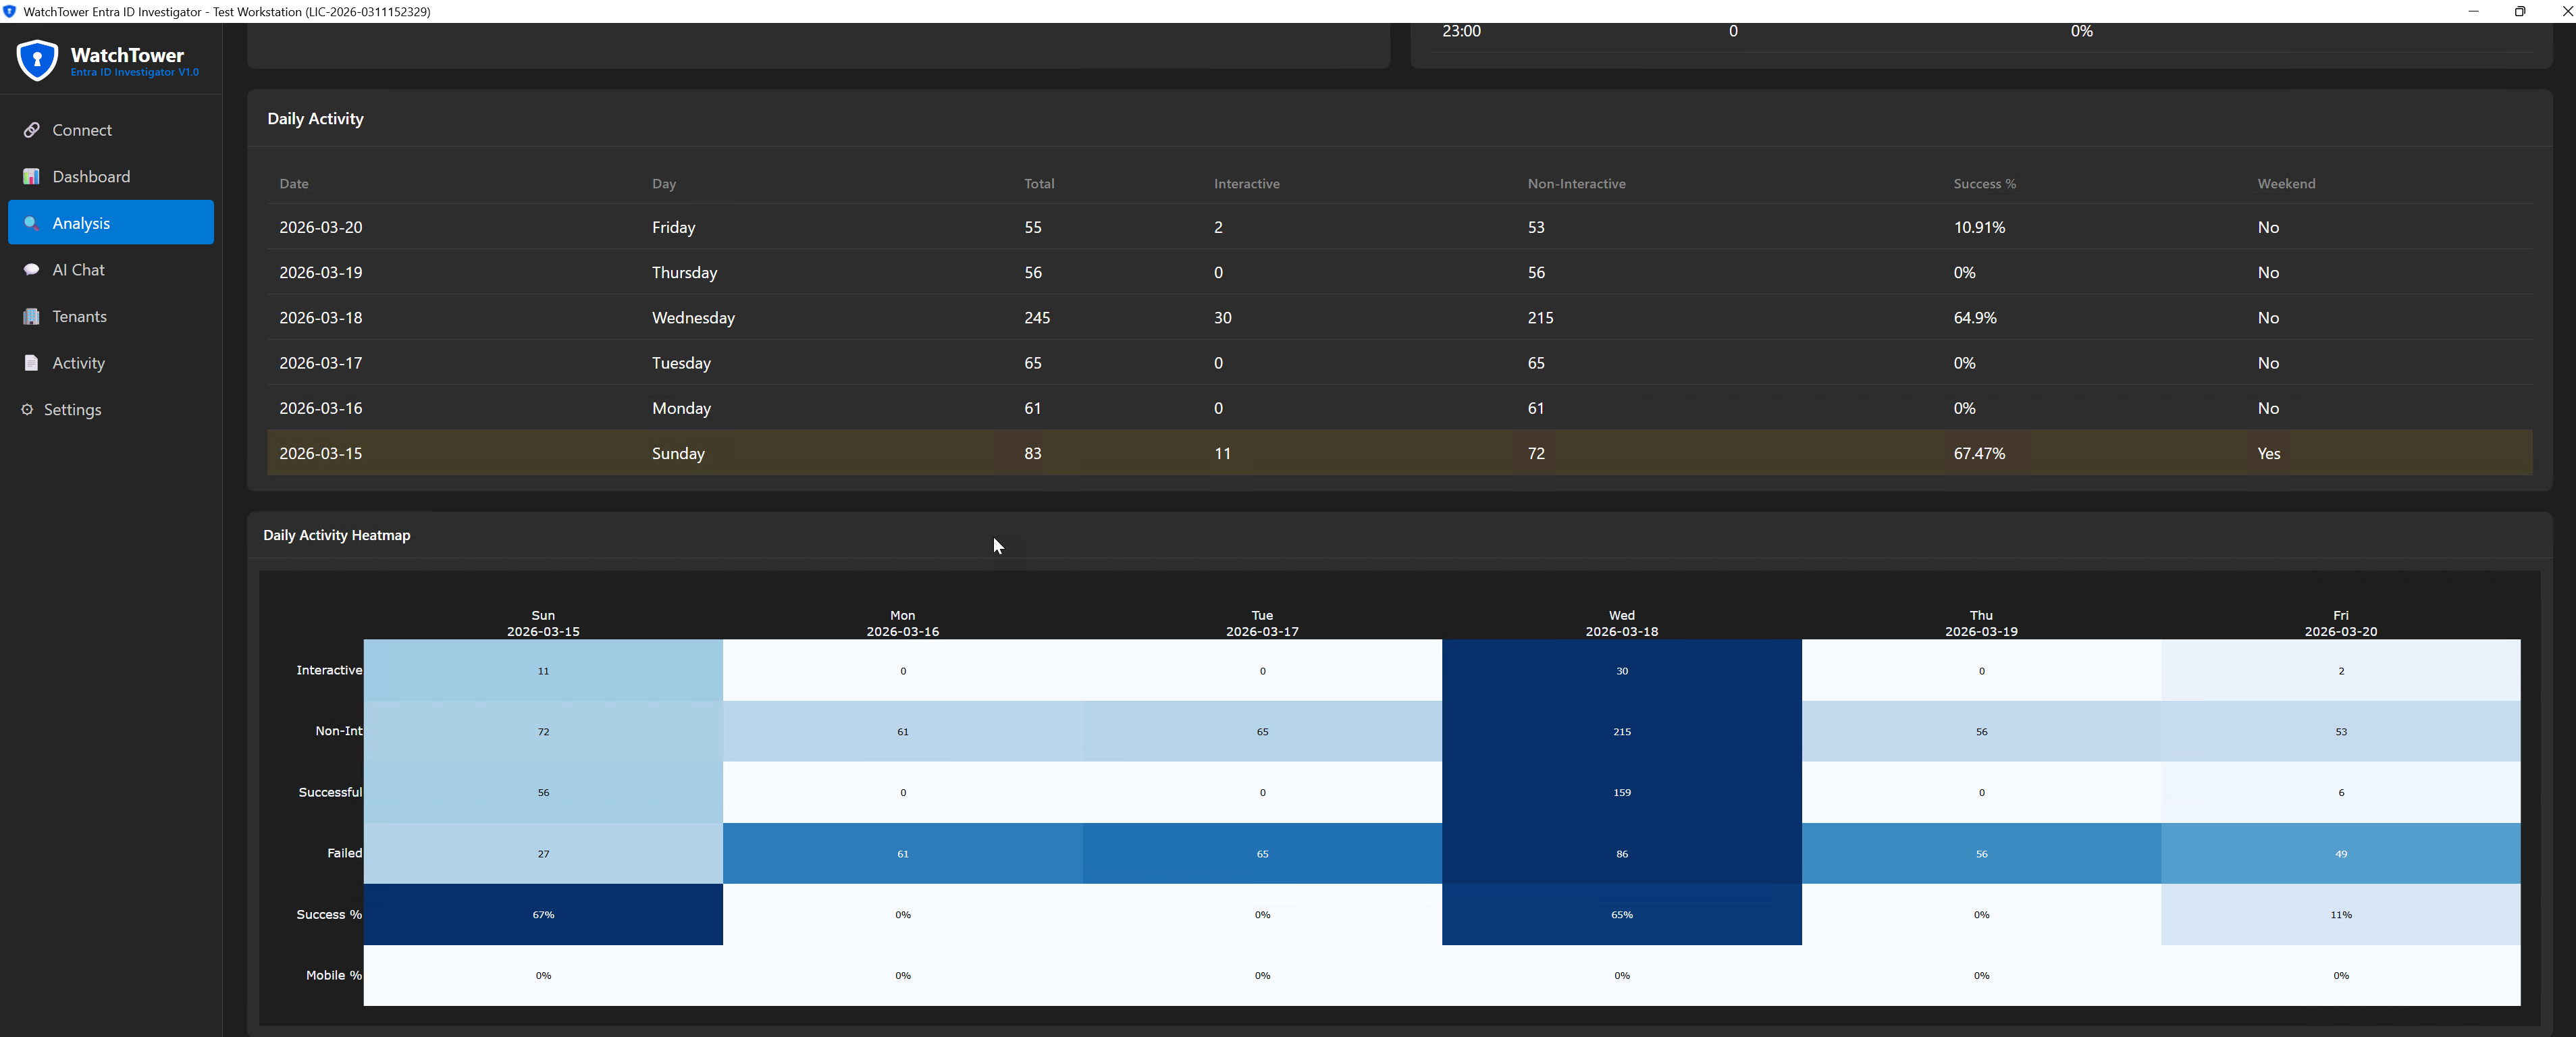
When you run WatchTower, you receive structured analysis across multiple dimensions
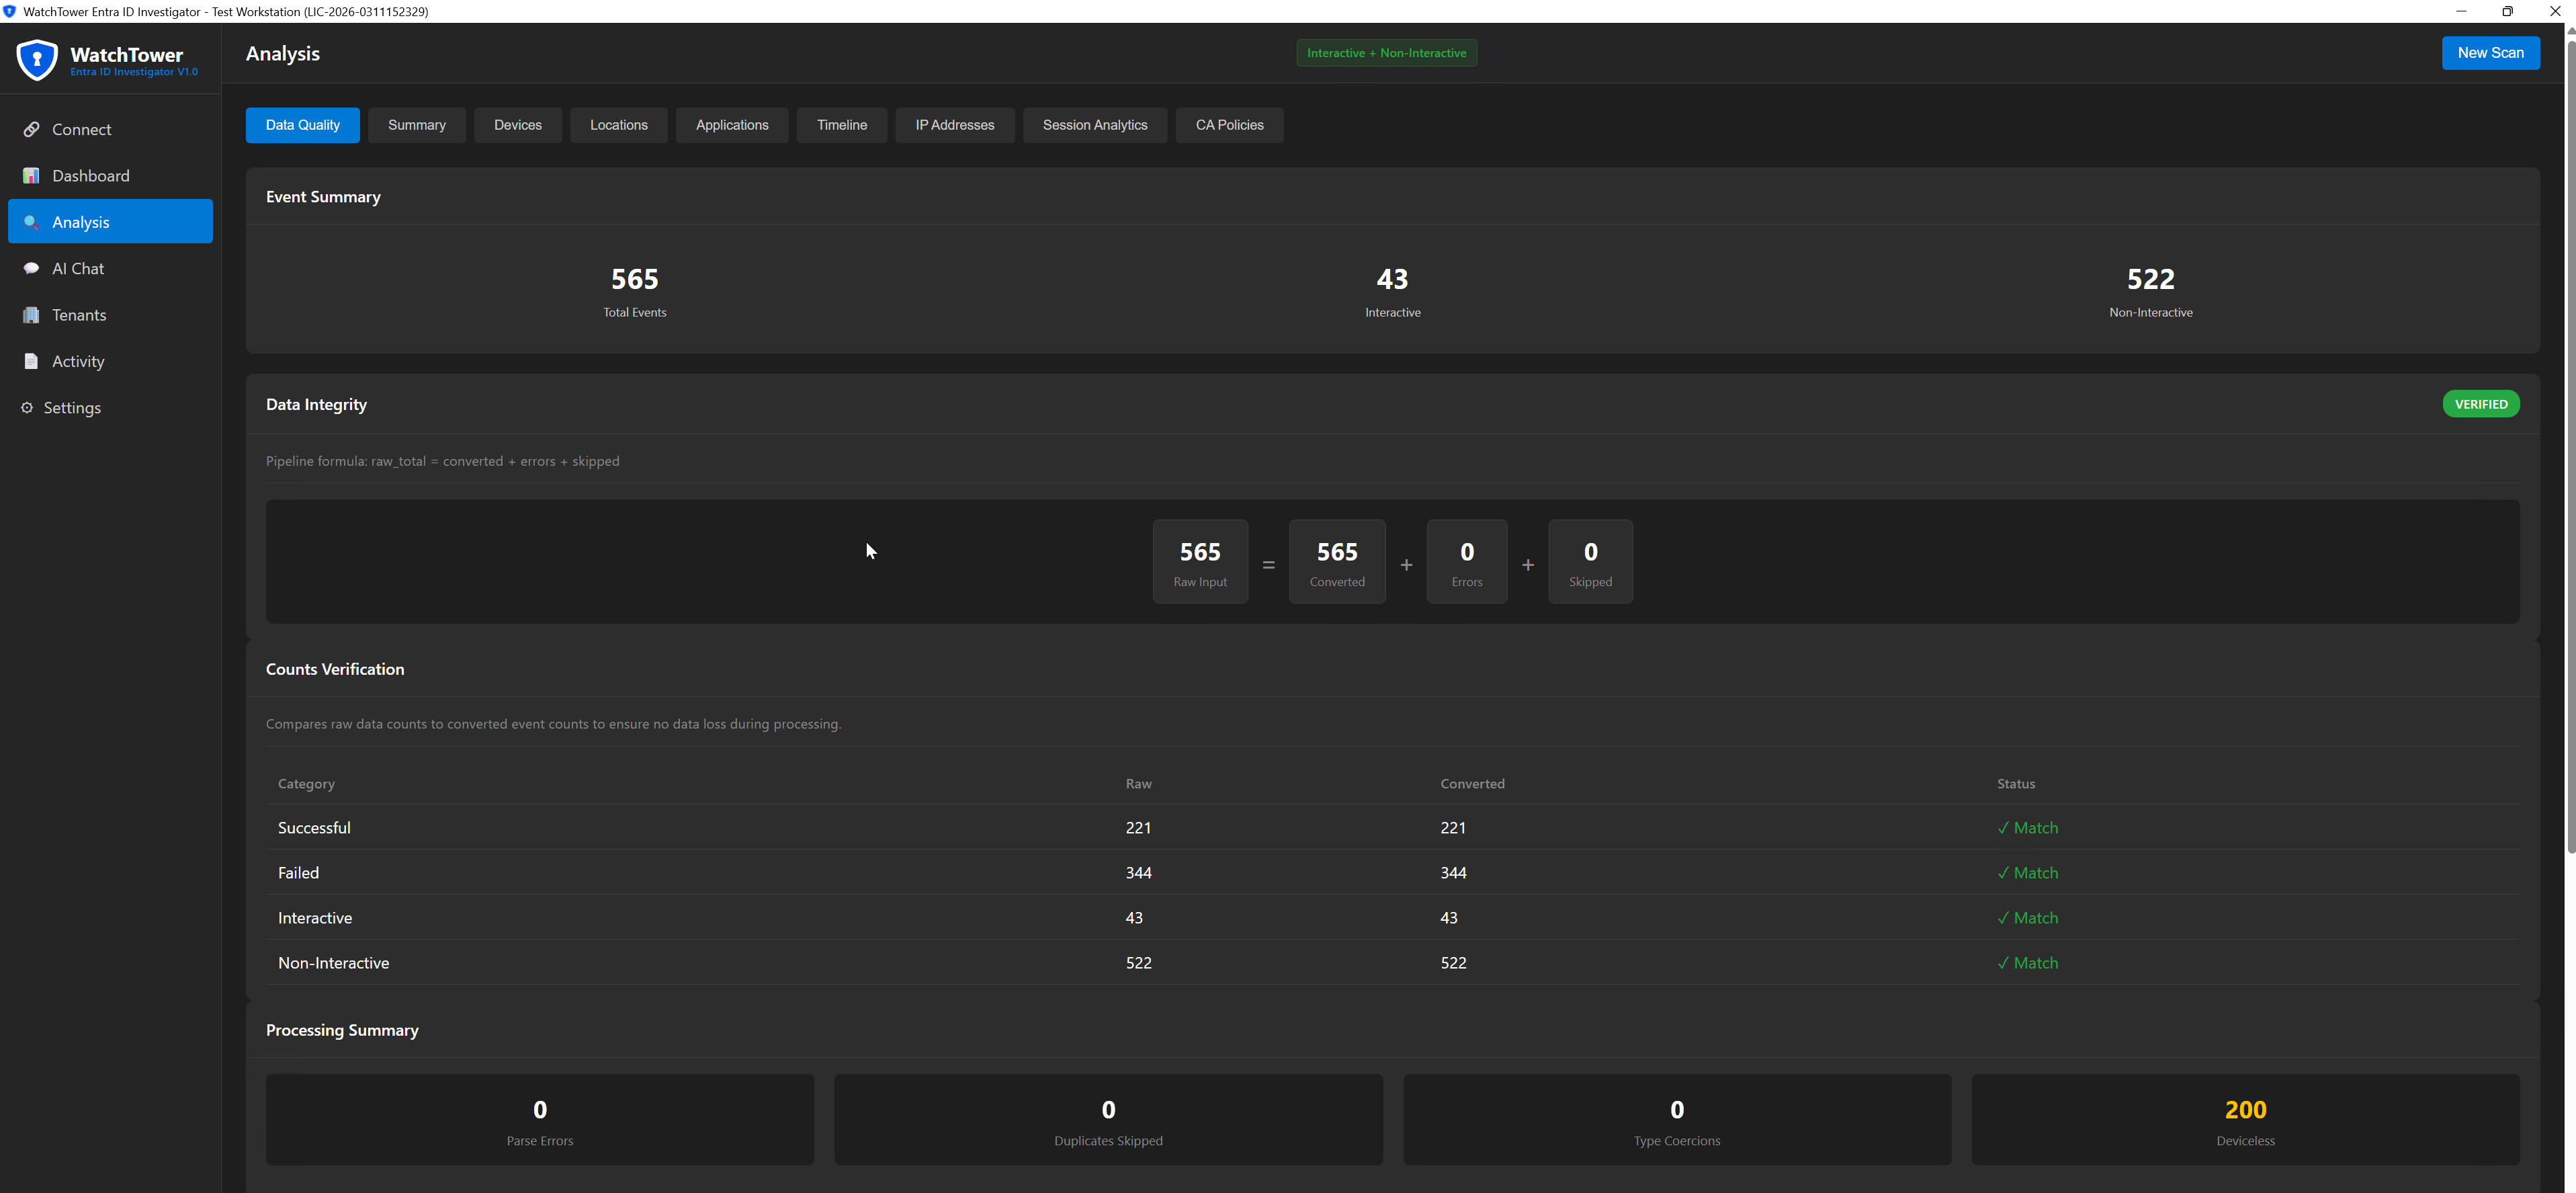
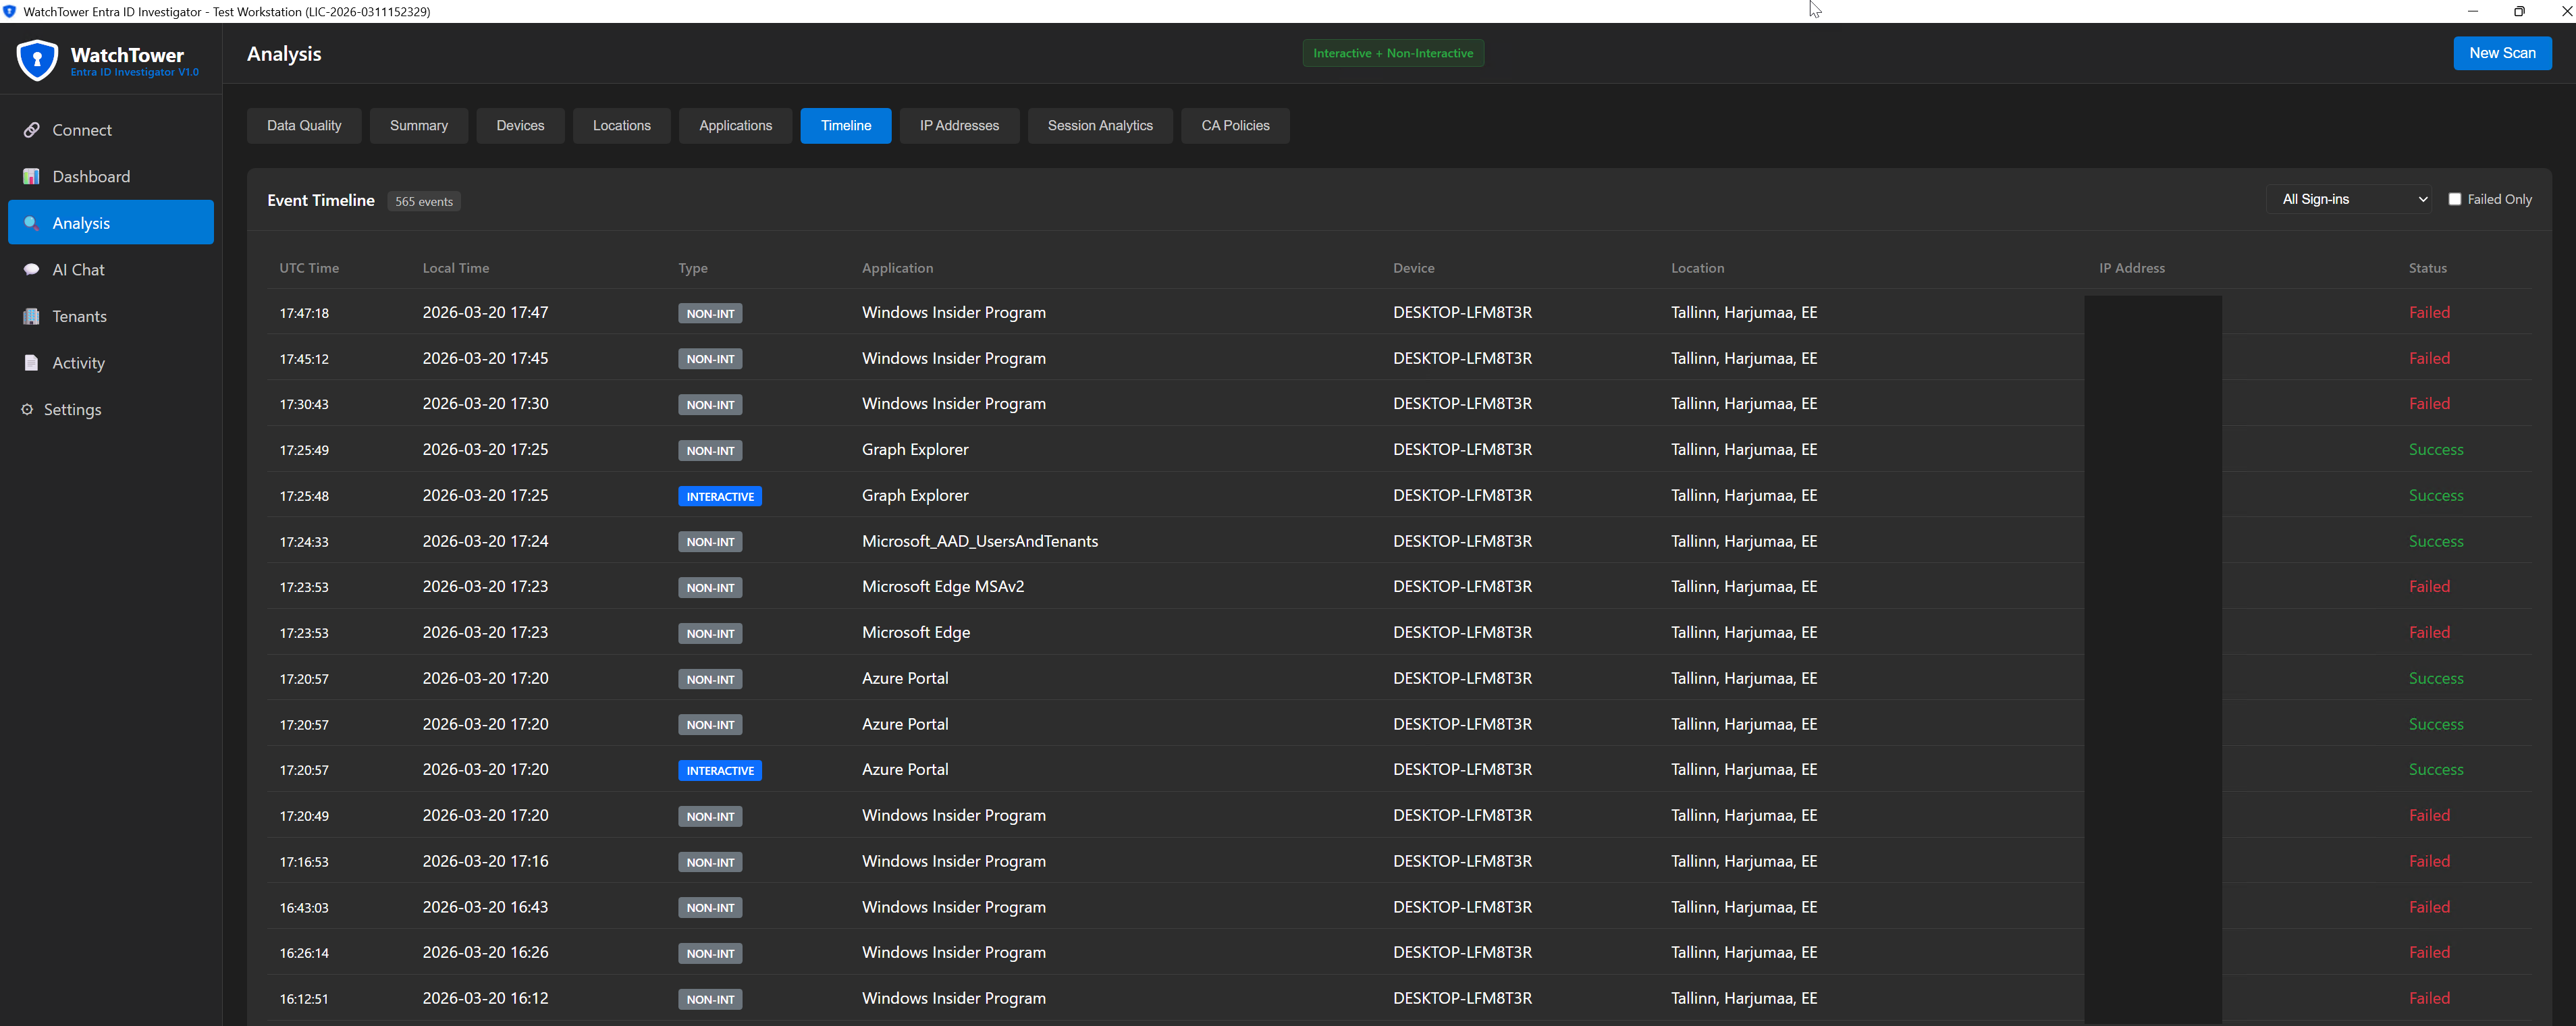
Every sign-in event in chronological order with correlation IDs preserved for audit trail purposes.
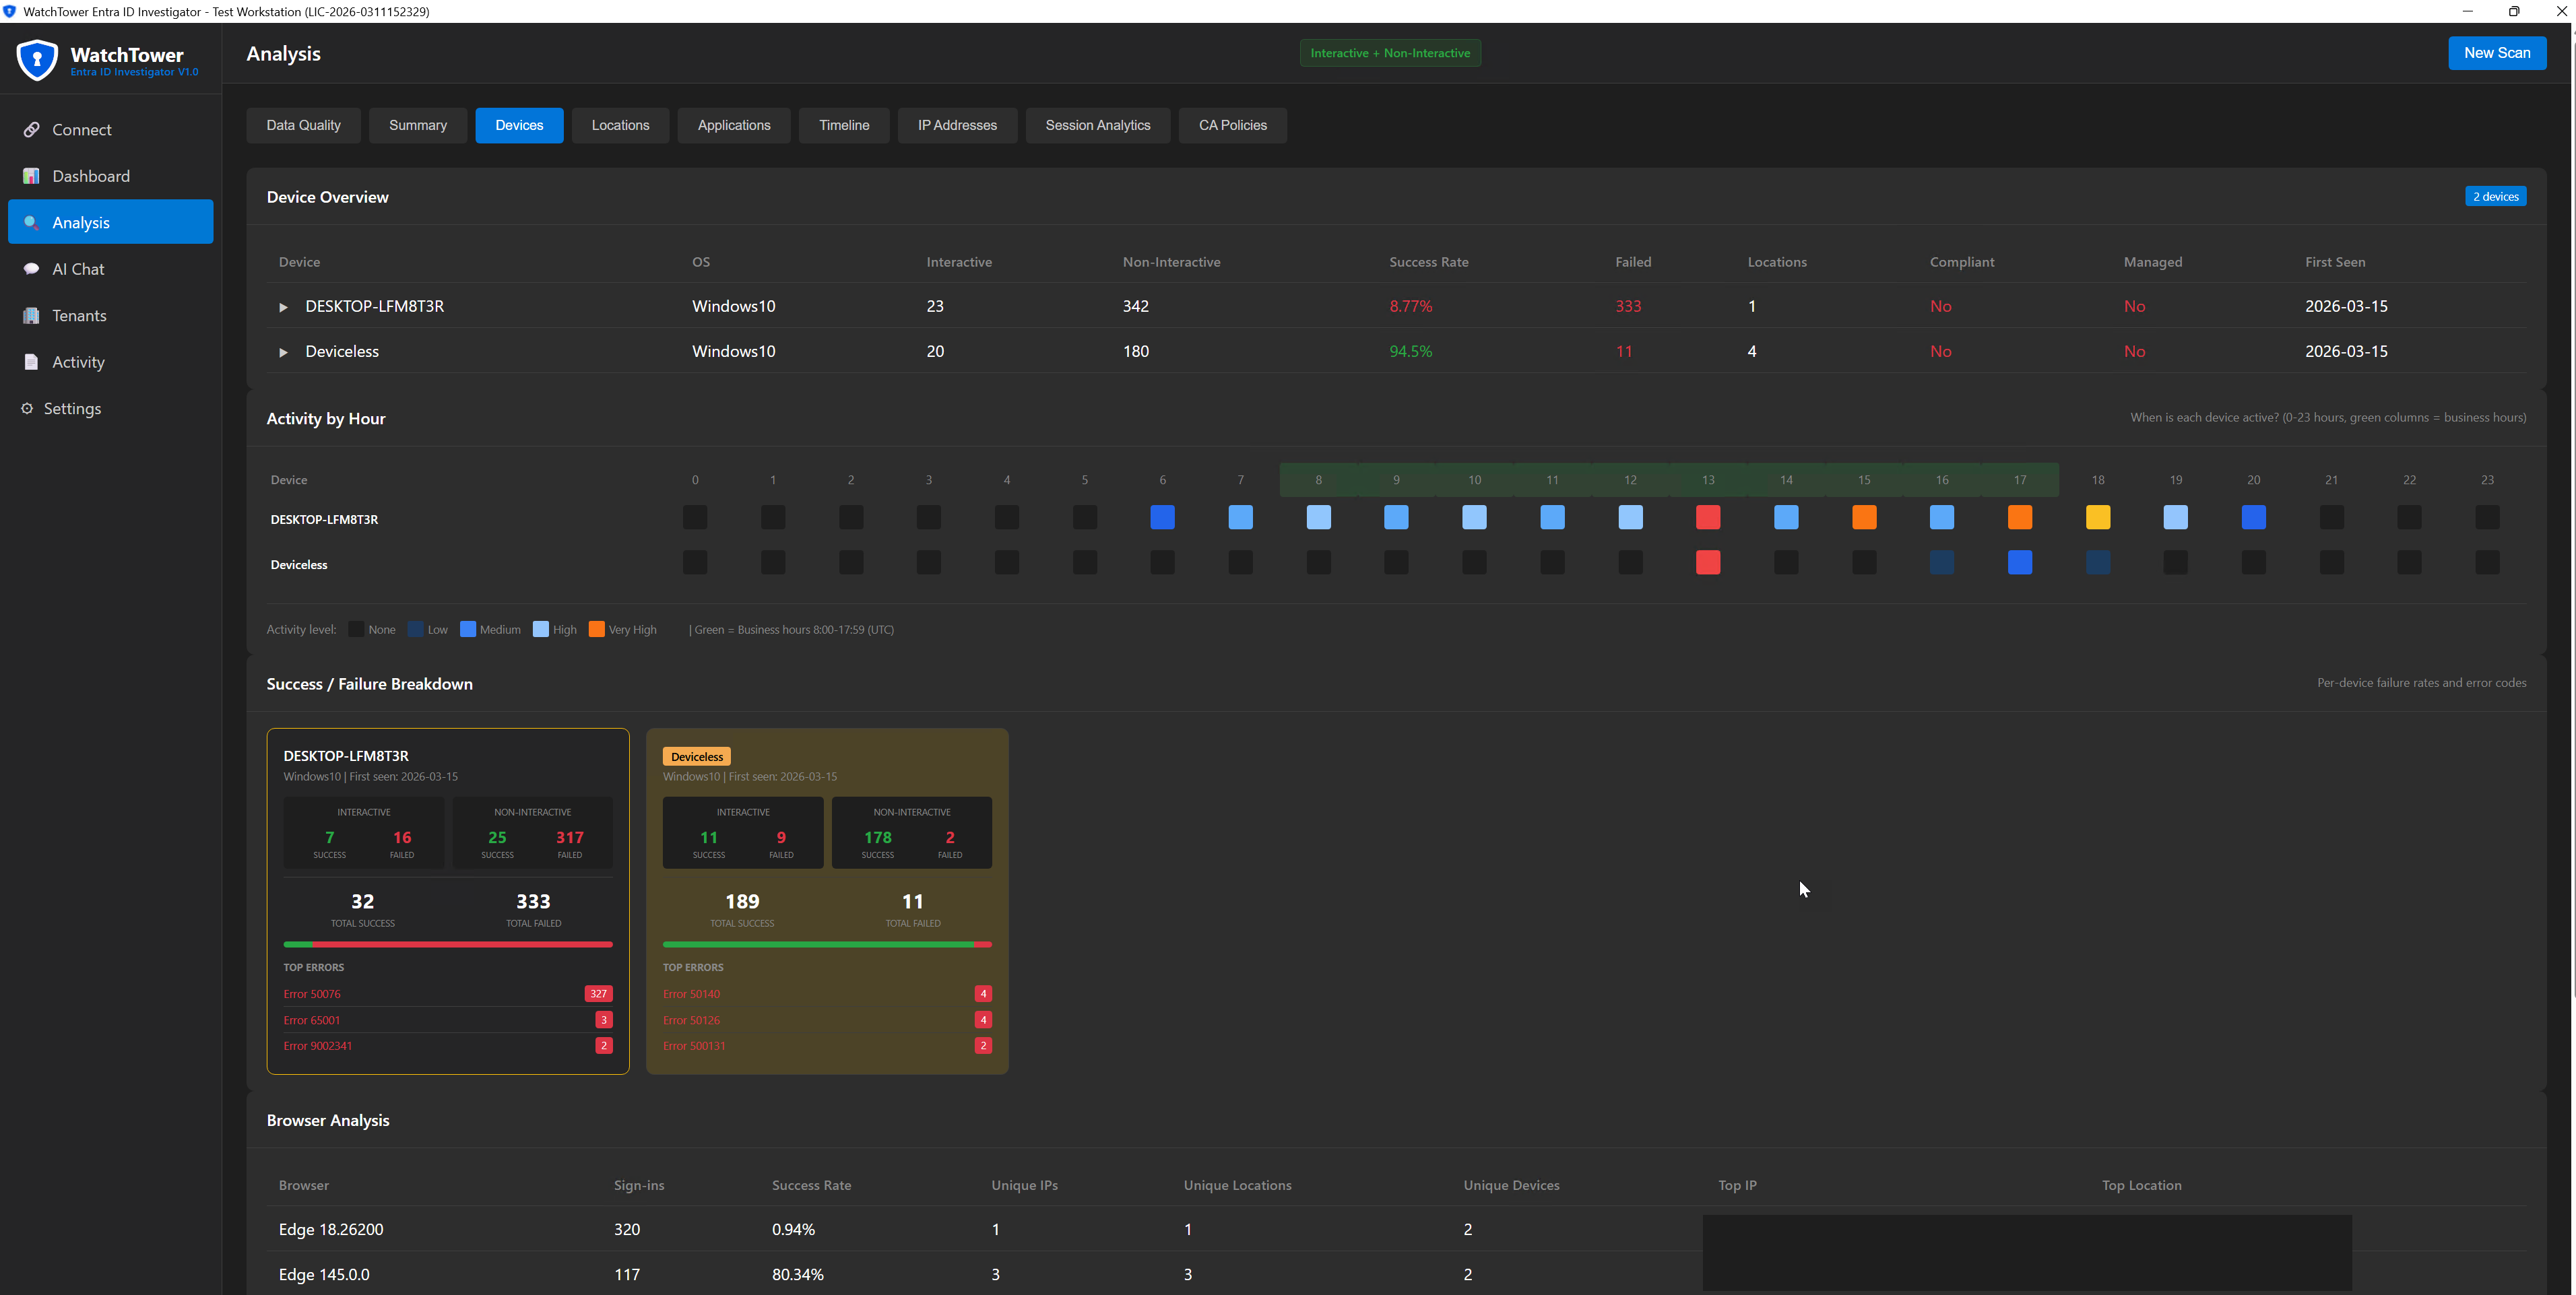
Complete breakdown of devices used, including compliance status, operating systems, and browsers.
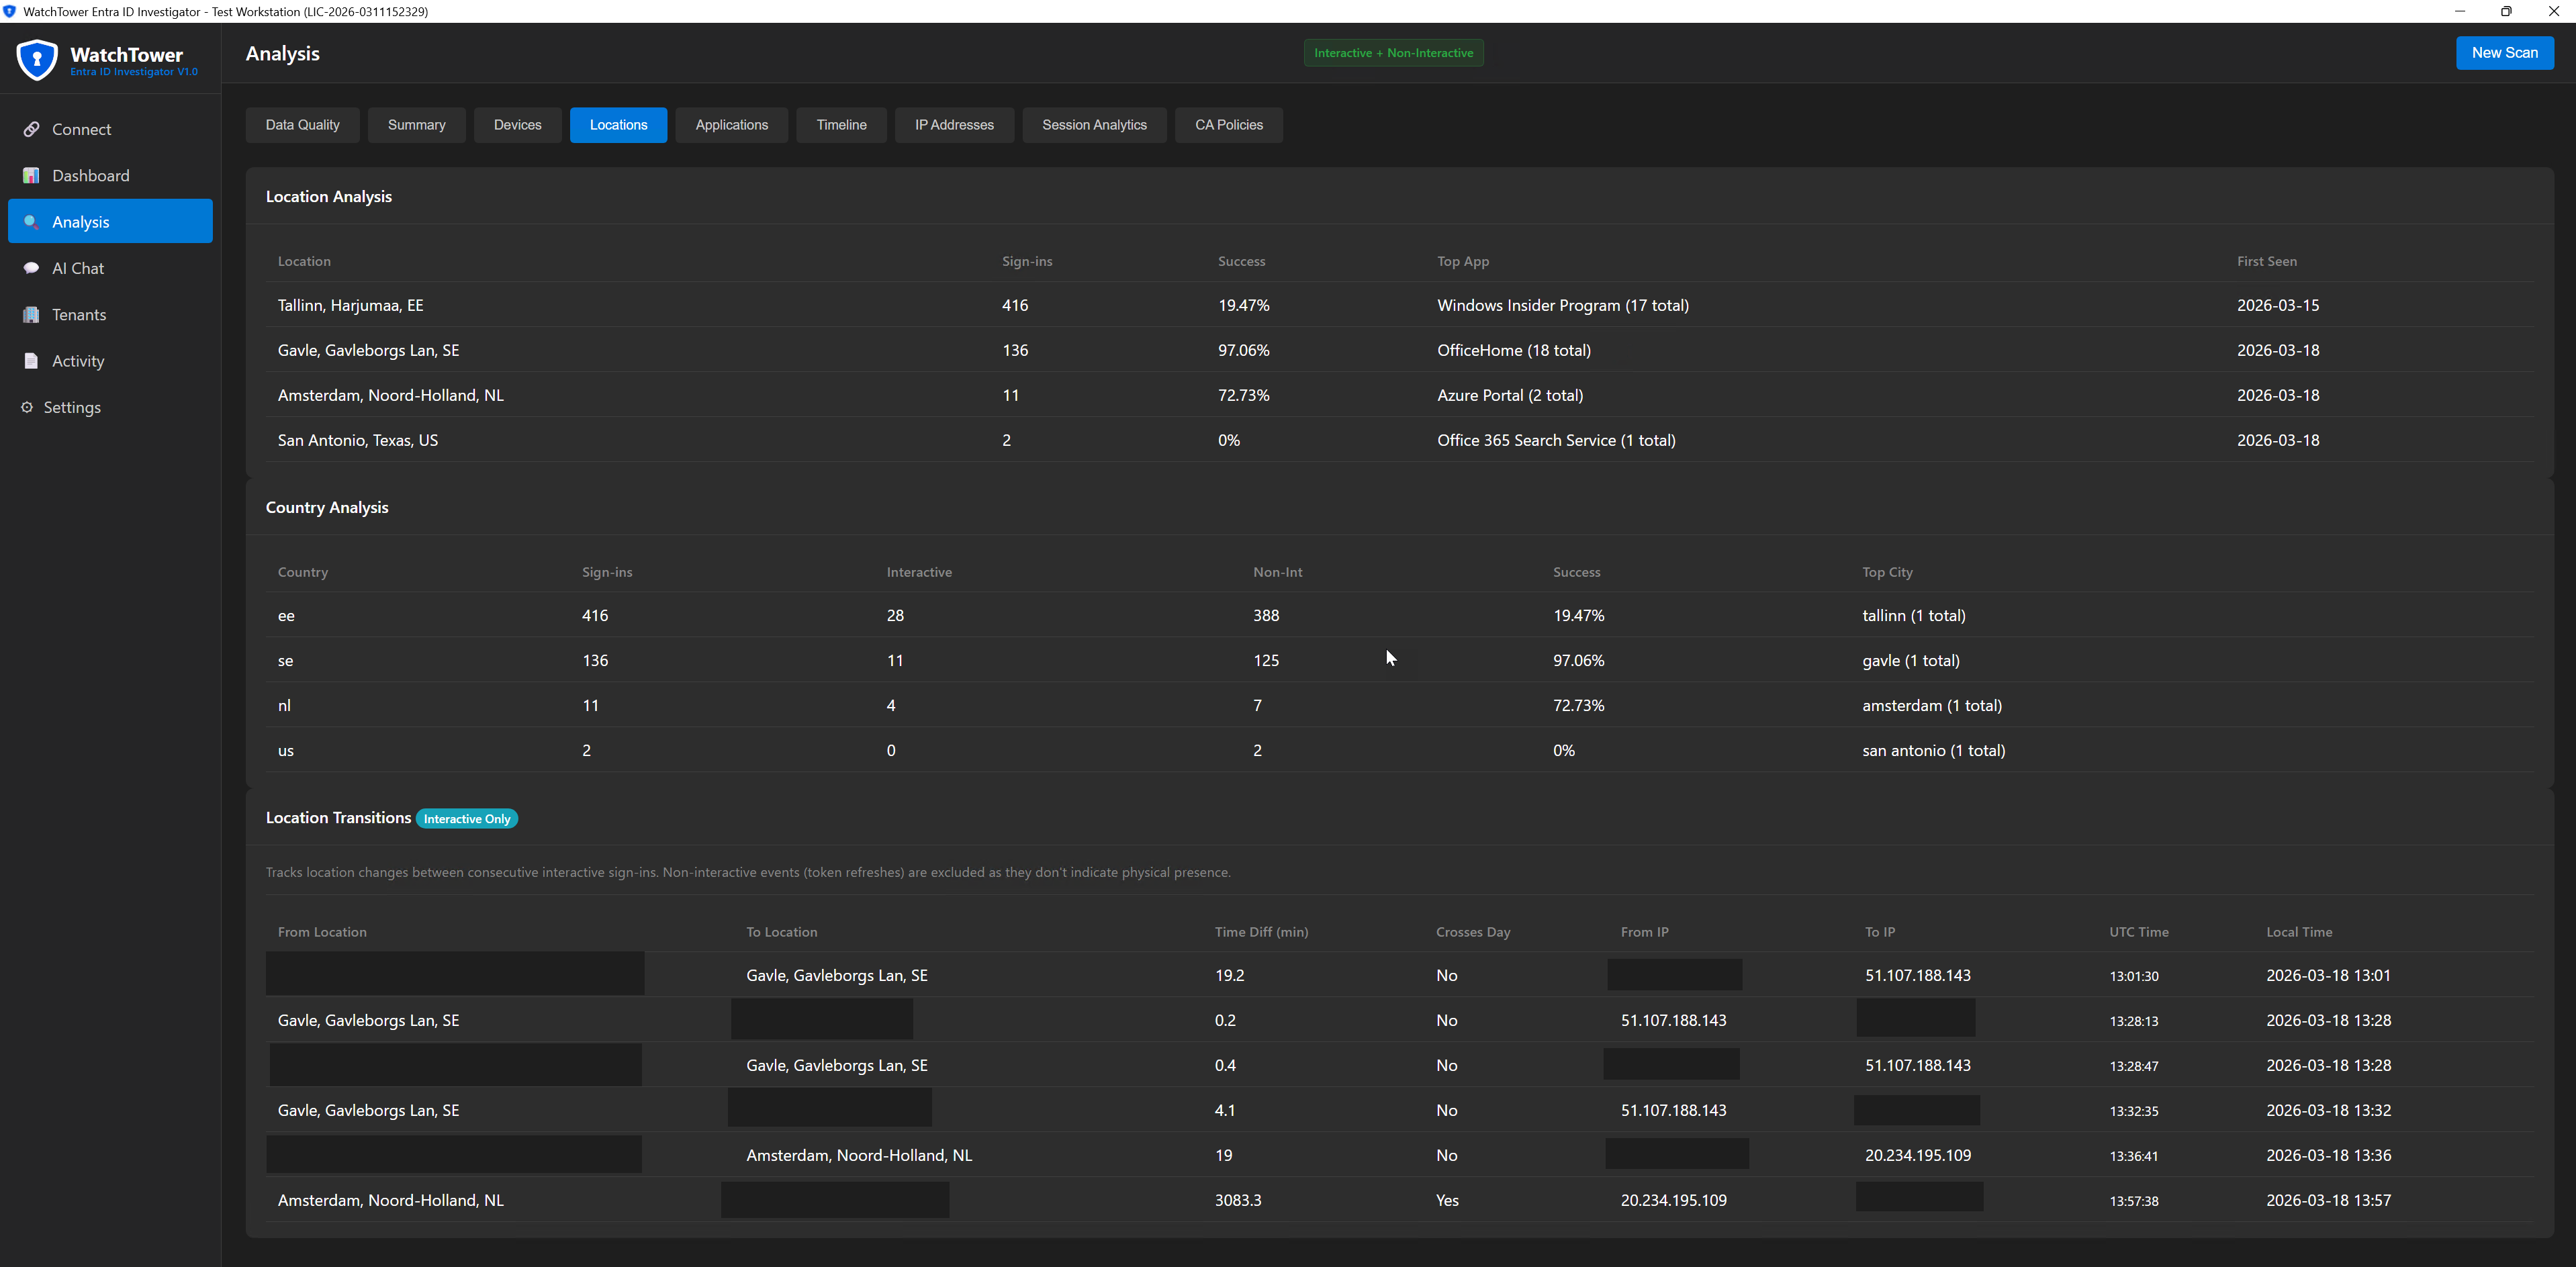
Geographic view of where sign-ins originated, including location transitions showing movement patterns.
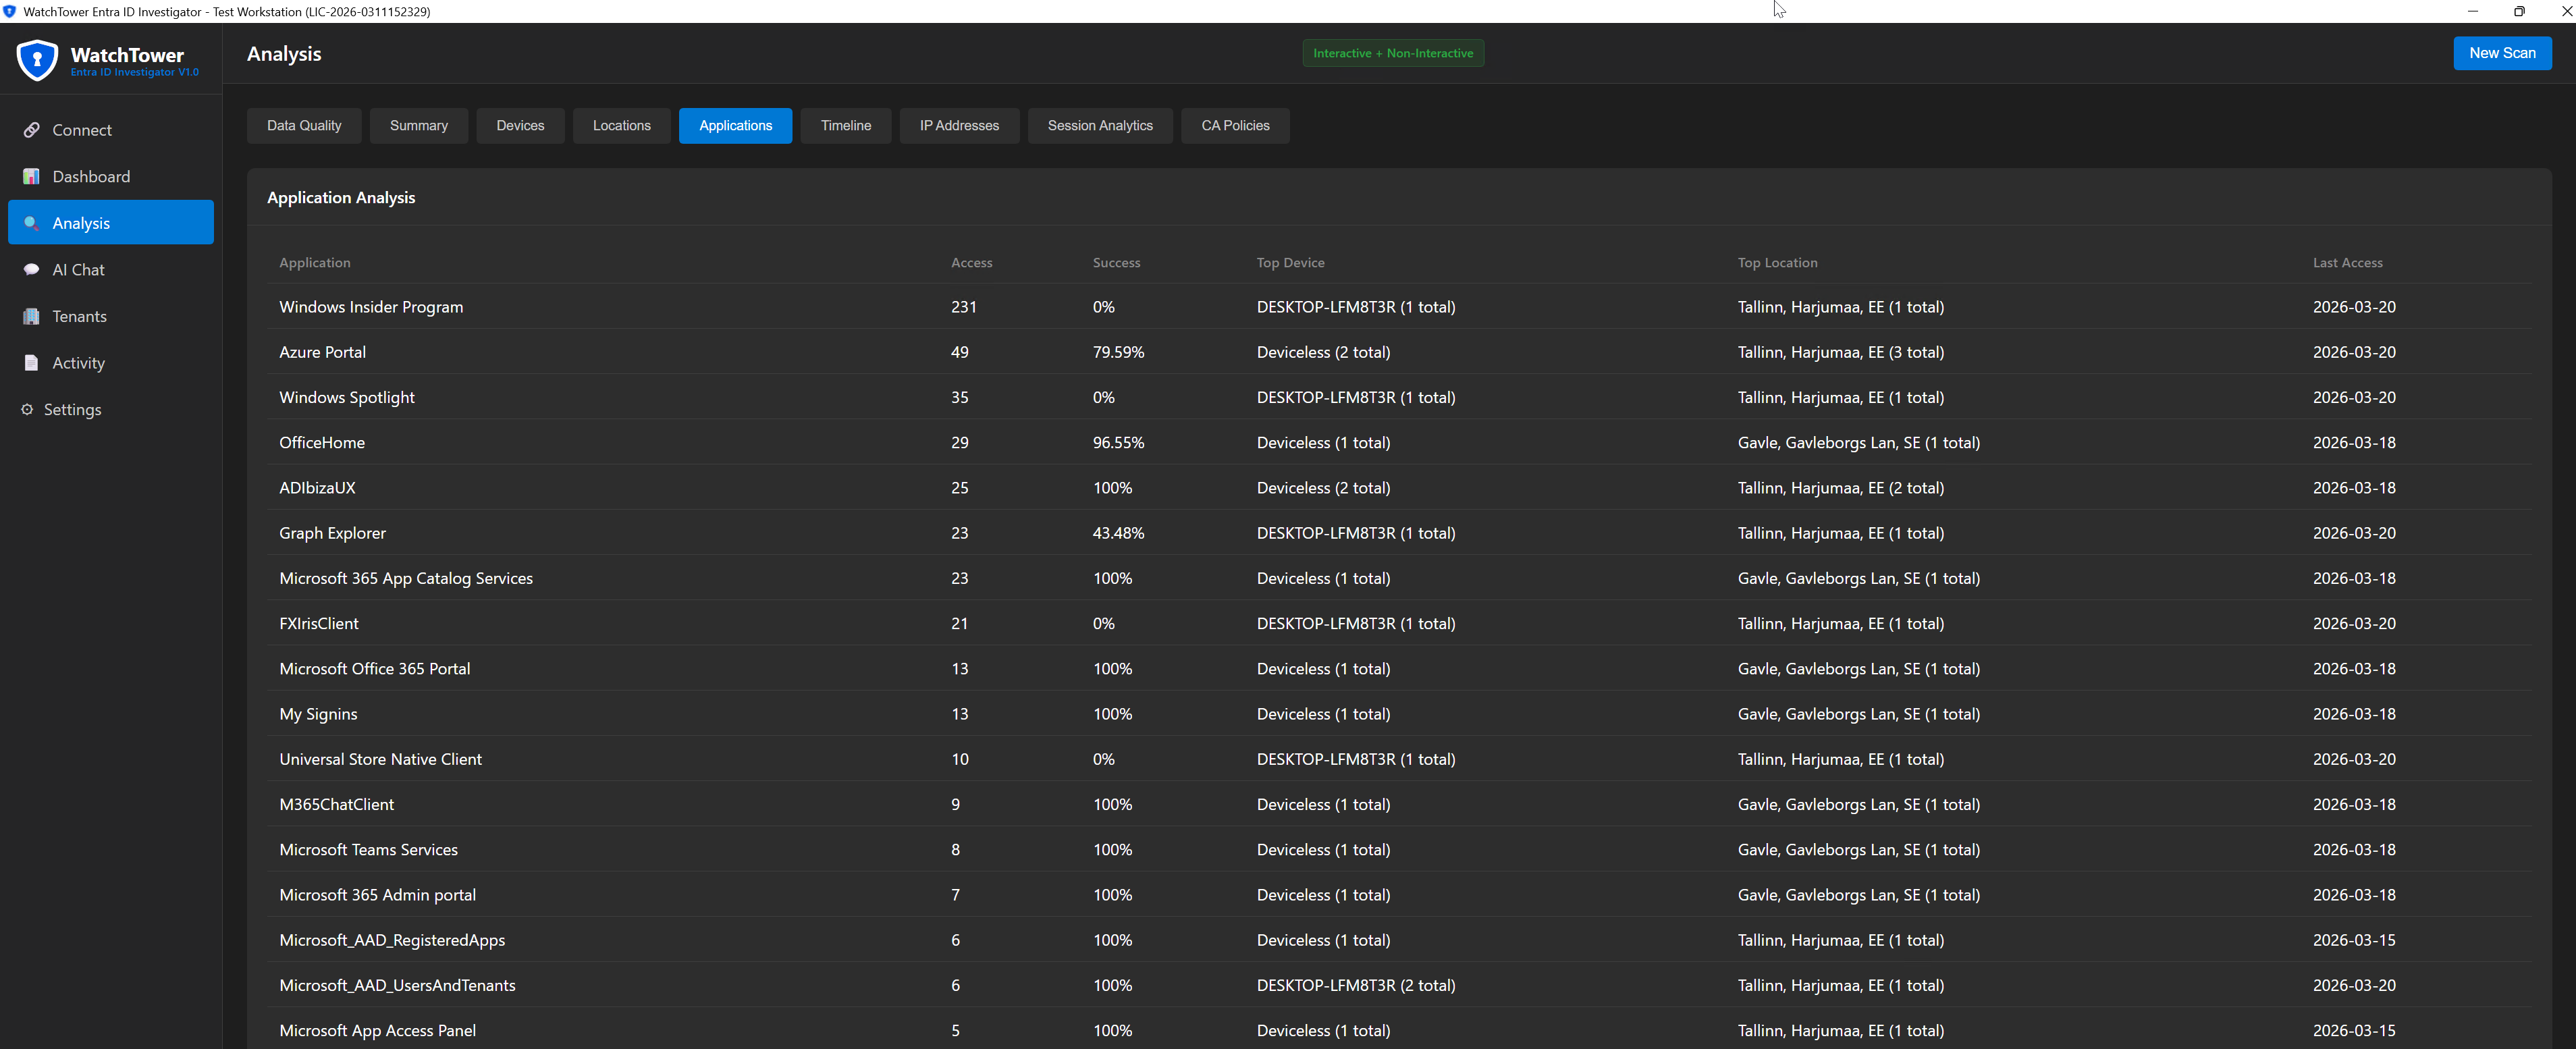
Which applications the user accessed and how frequently, giving visibility into actual usage patterns.
Network-level view showing which IP addresses were used, with behavioral patterns for each.
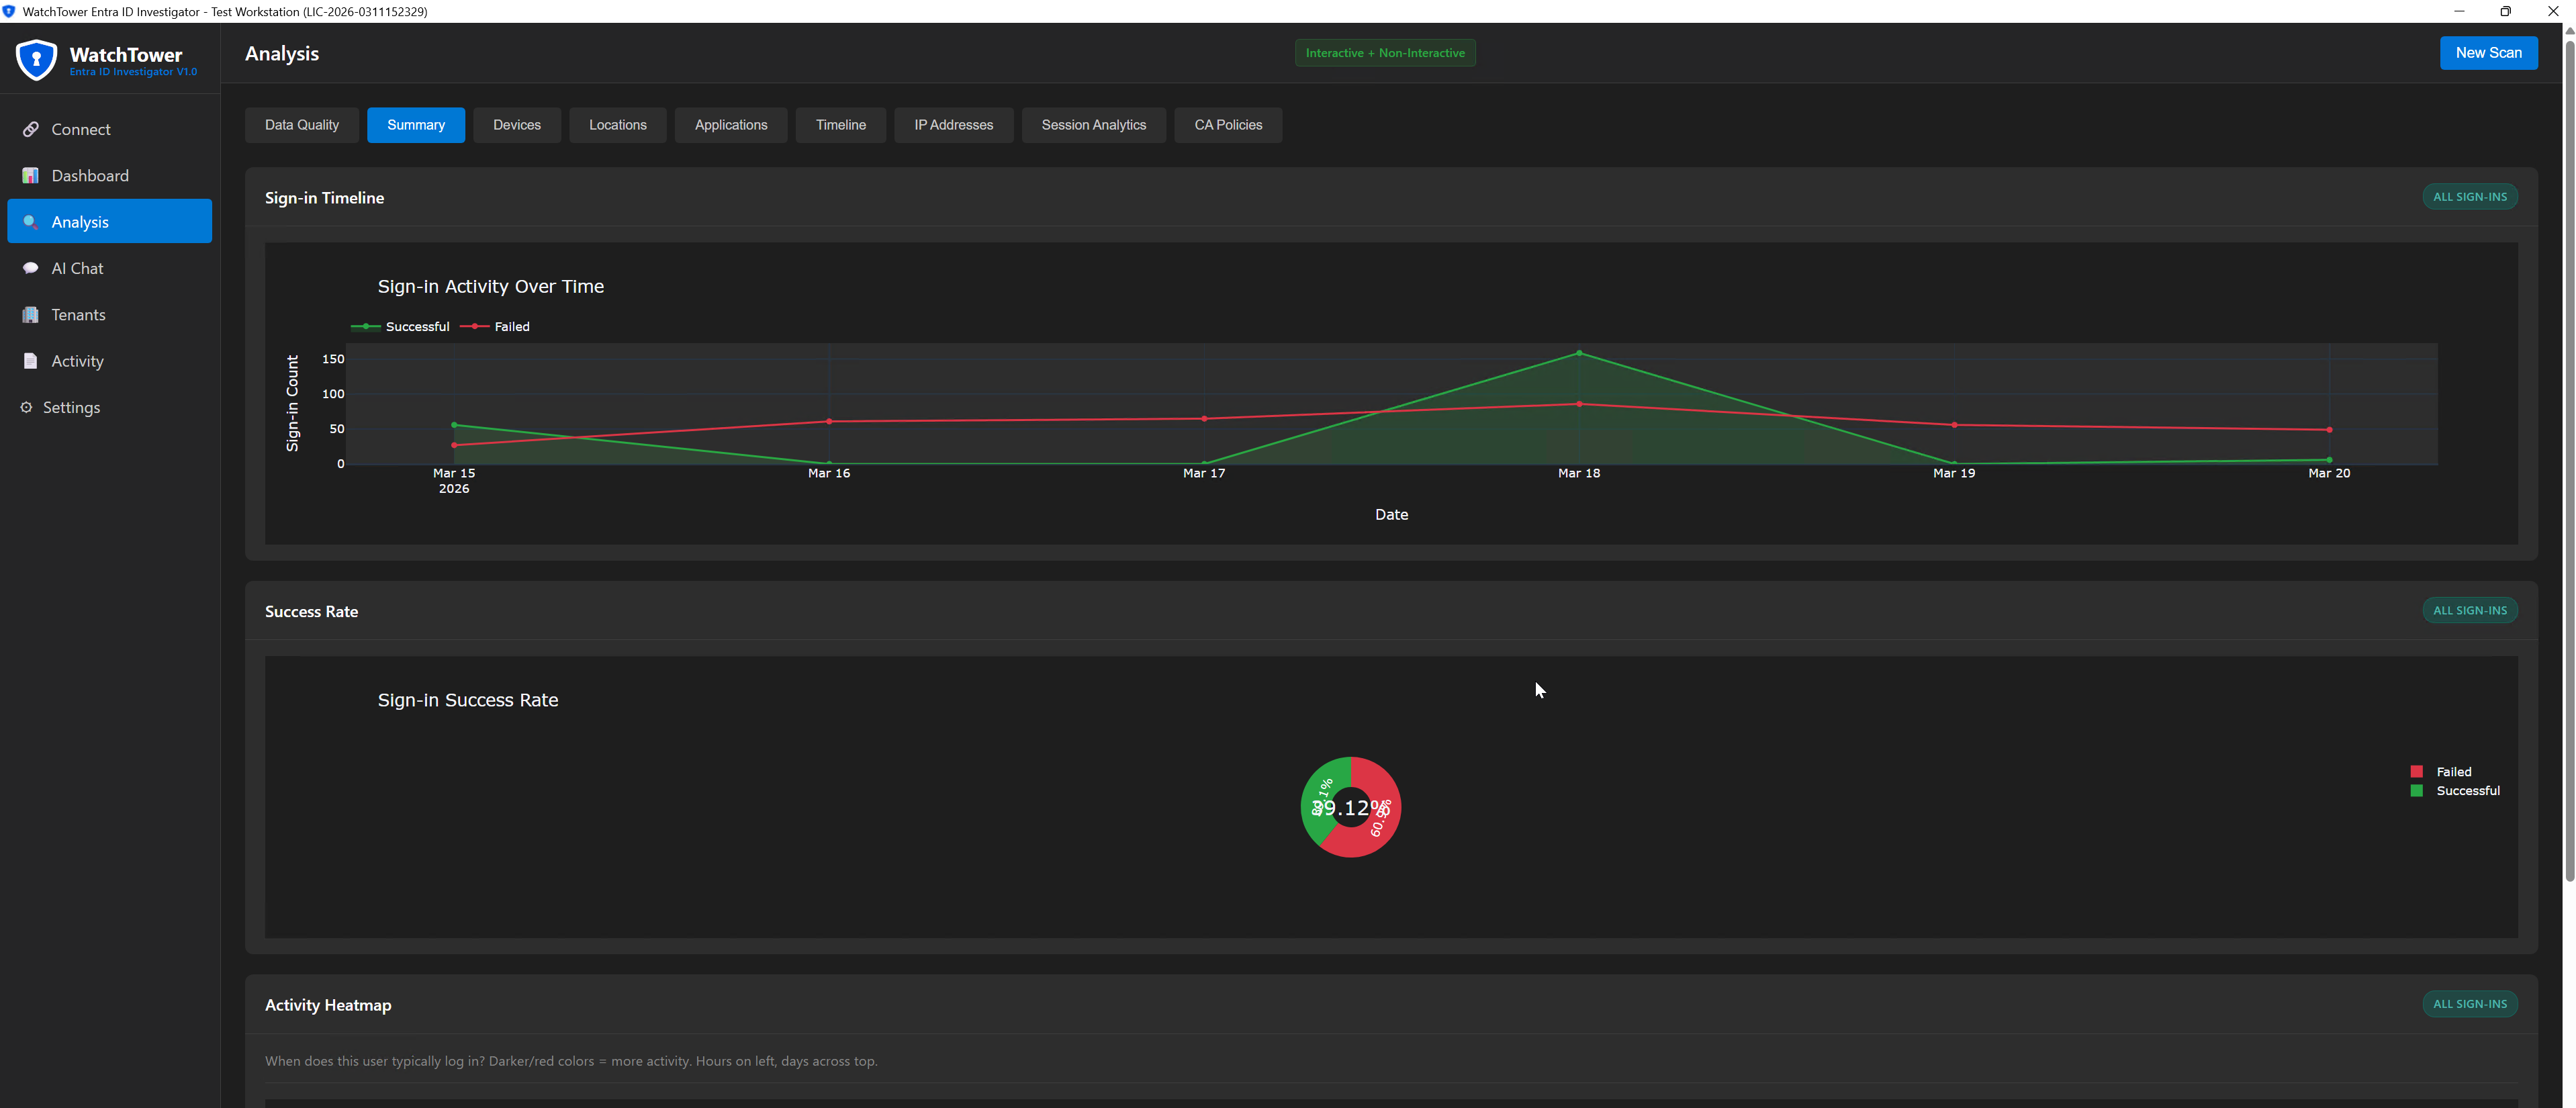
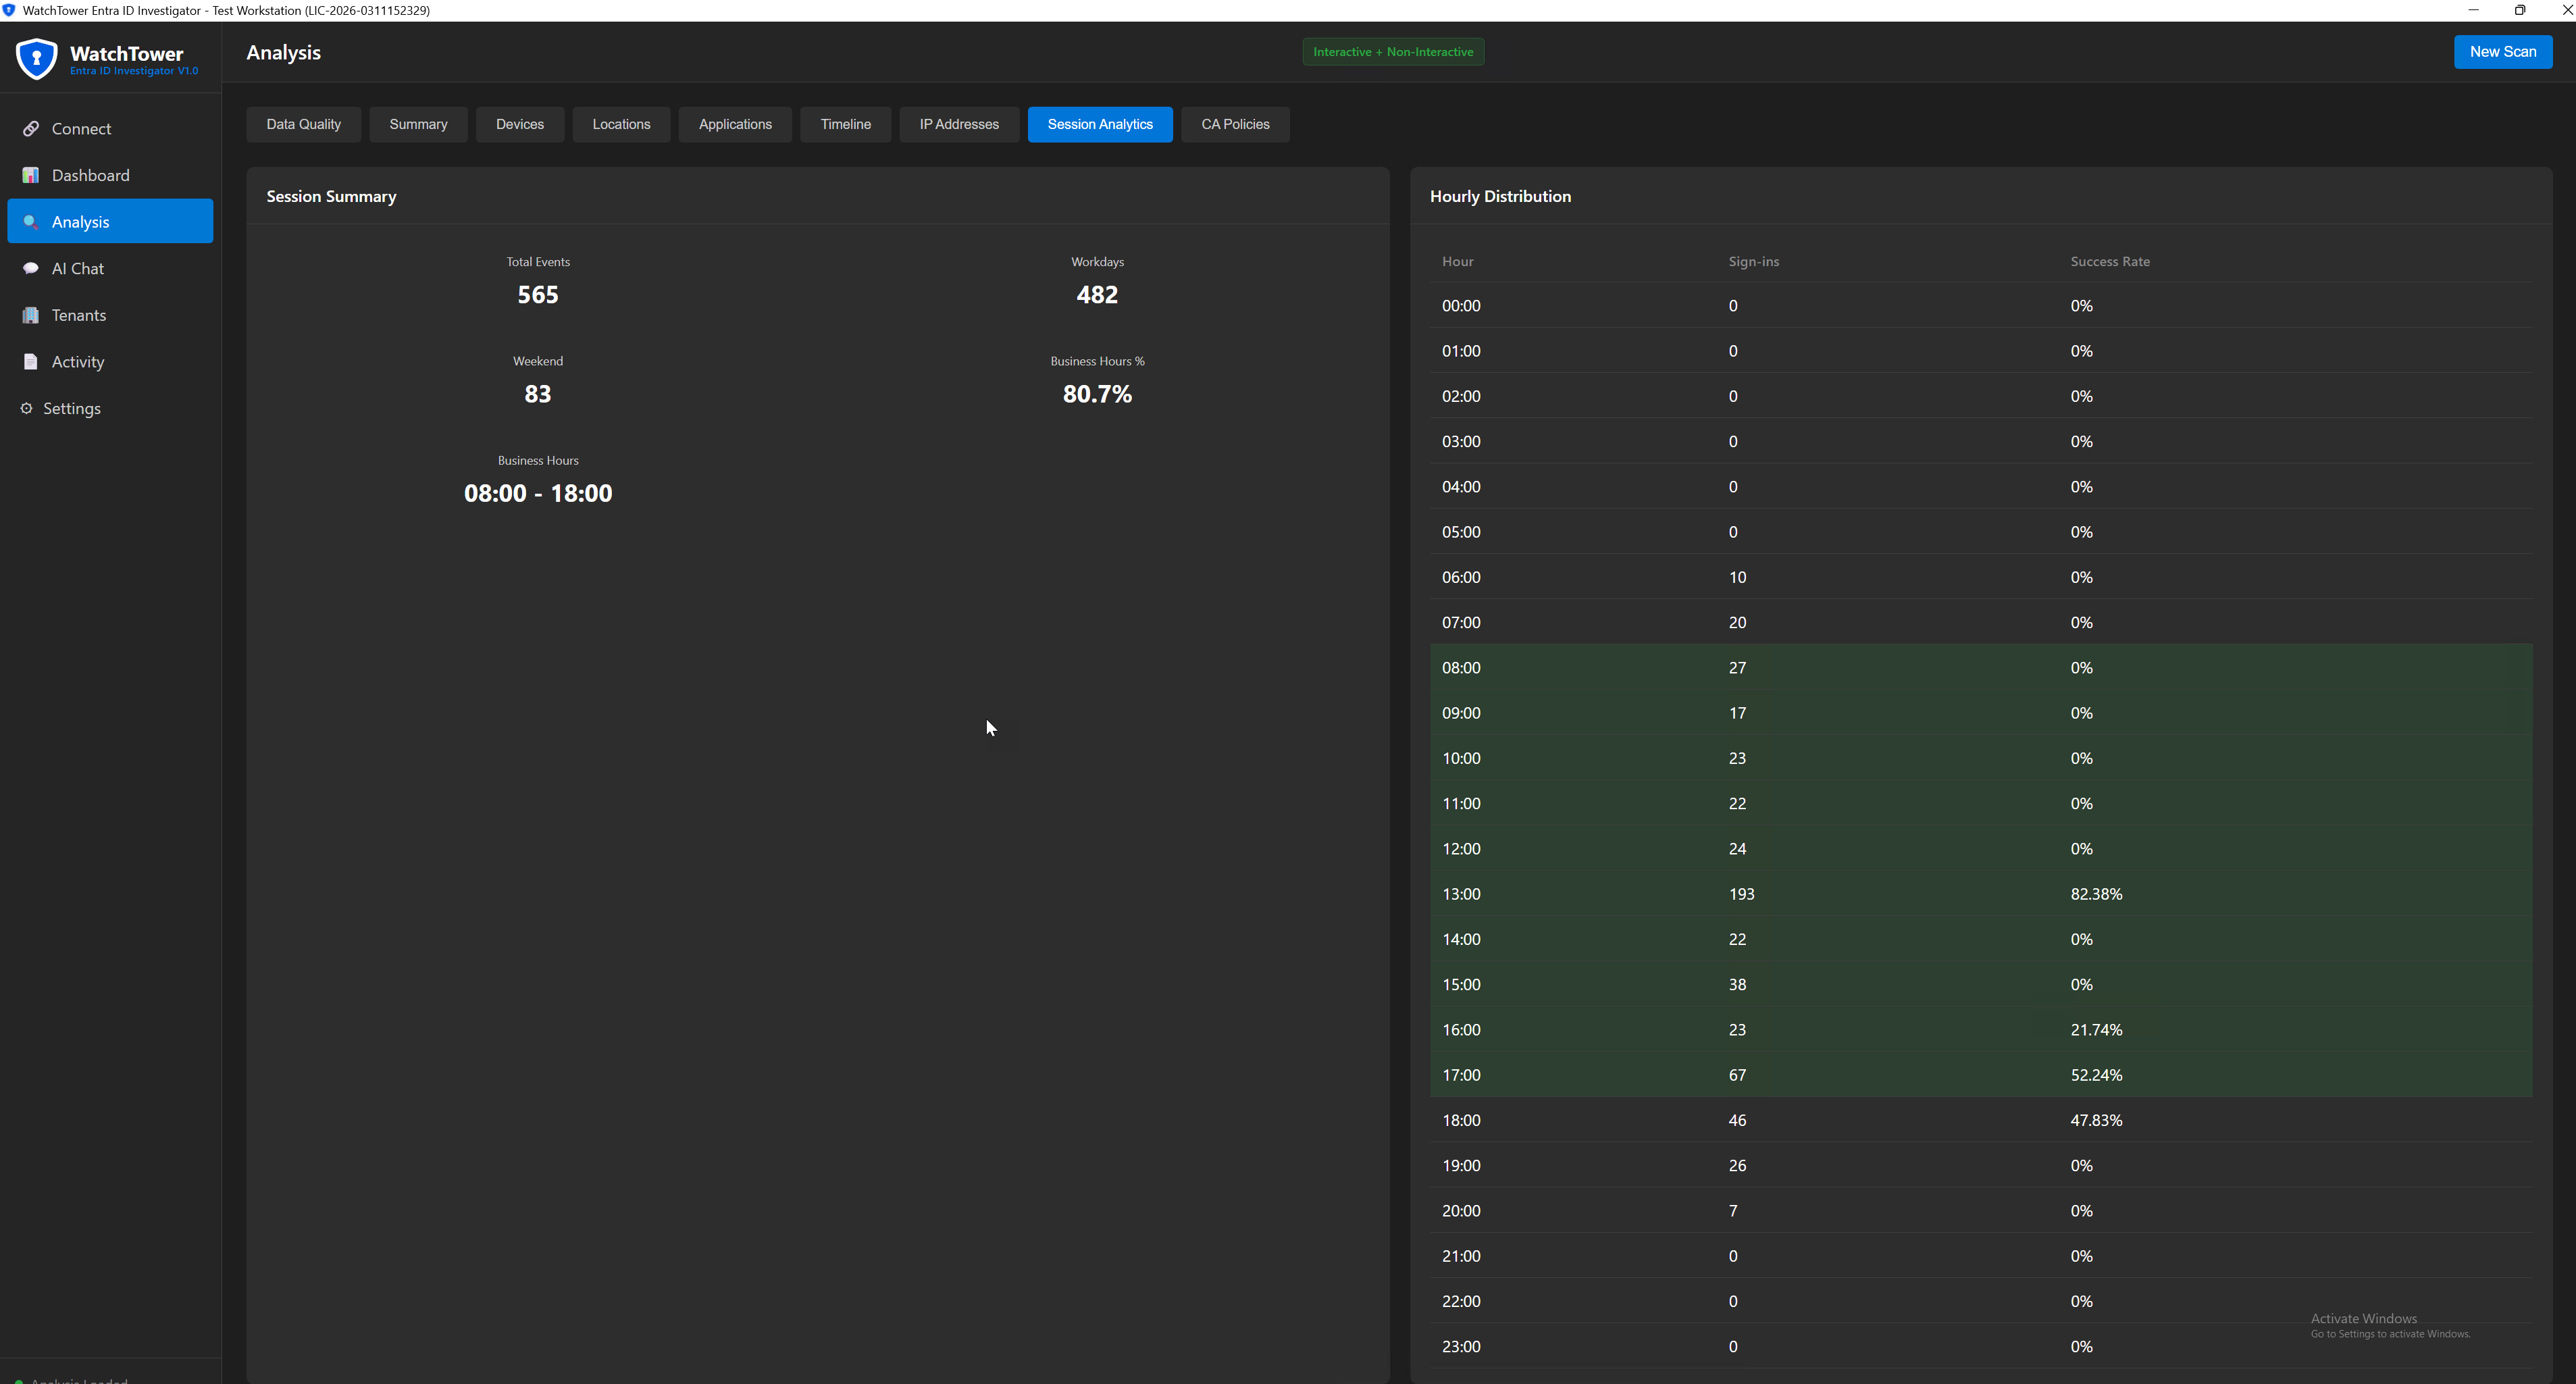
Hourly and daily activity patterns, plus business hours versus off-hours breakdown.
See which Conditional Access policies are triggered per application based on actual sign-in events.
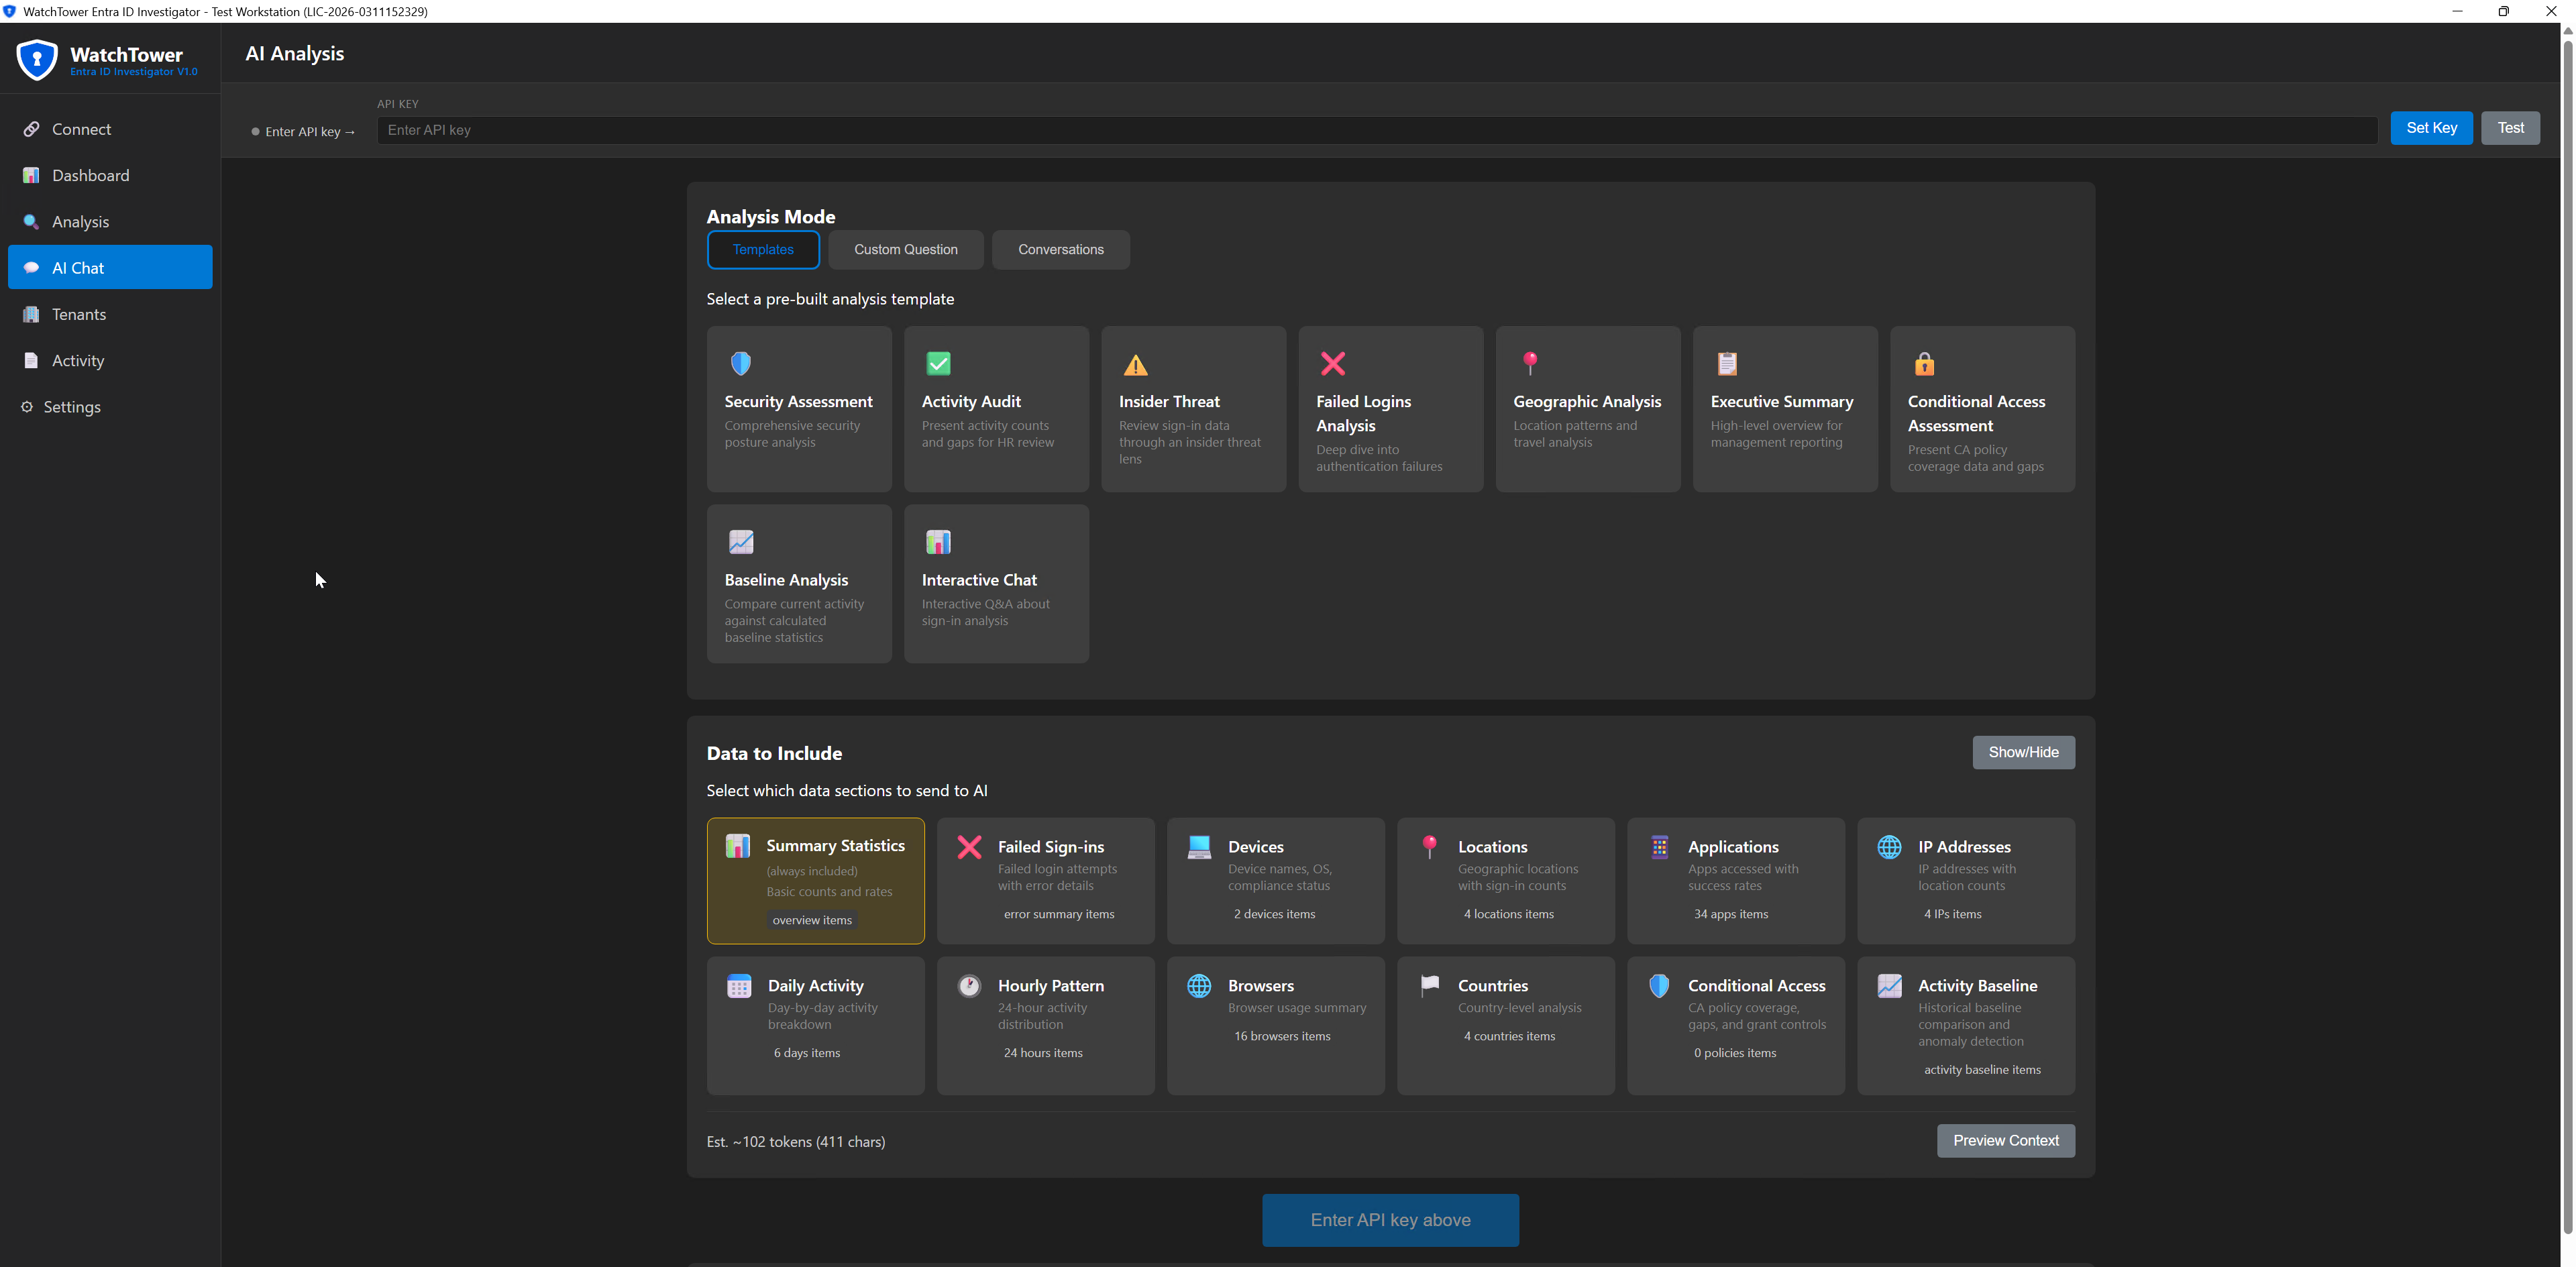
All analysis exported as structured CSV files with visual charts suitable for executive reporting or compliance documentation.
Video demonstration coming soon
Yearly license with full access to documentation and updates
Start investigating user sign-in activity with structured data instead of raw logs.
When you need to understand account activity - whether for incident response, suspicious behavior analysis, or routine security review - WatchTower gives you the structured data foundation you need to work from.
When someone asks for information about user access patterns, you can deliver organized analysis instead of raw exports that require additional processing.
Auditors ask quantified questions about access patterns. WatchTower provides the structured data that turns "we reviewed the logs" into specific answers with supporting documentation.
Not every environment has Sentinel or Splunk. WatchTower provides investigation capability without requiring enterprise security platform investment.
WatchTower extracts sign-in logs from Microsoft Graph API - the same data you see in the Entra ID portal. This includes timestamps, locations, devices, applications, success/failure status, and compliance information.
As far back as your tenant retains sign-in logs. Free tier keeps 7 days, P1/P2 keeps 30 days. With extended retention configured, you can go back further.
Read-only access: AuditLog.Read.All and Directory.Read.All permissions, with Global Reader or Security Reader role. No write permissions are needed or requested.
No. WatchTower is a data extraction and organization tool - it gives you structured views of sign-in activity. Interpretation and scoring decisions remain with you. This is by design.
WatchTower is a Python application with a built-in user interface. You launch it, connect to Graph API, set your parameters, and the analysis runs automatically. No command-line expertise required.
WatchTower runs locally in your environment. Data is extracted from Graph API and saved to your machine as CSV, JSON, and chart files. Nothing is sent anywhere else - you control the data completely.
WatchTower was built from REAL investigation requirements - the need to understand user sign-in patterns quickly and thoroughly without spending hours manually processing portal exports.
Developed by Kaido Järvemets, Microsoft MVP since 2010 with fifteen years of experience in Microsoft security and identity management. The tool reflects practical investigation needs encountered across enterprise environments, not theoretical feature design.
Stop scrolling through log entries. Get structured sign-in analysis that shows you the complete picture at a glance.
Interested? Fill out the form below and we'll get you started.
If you don't see the form below, please click here to open the form.
Please sign in to access exclusive premium content
For authorized members only
Sign in with GitHub